Backpack Carbon Footprinting: How Do Factories Measure Emissions?
Backpack Carbon Footprinting: How Do Factories Measure Emissions?
A carbon footprint for a backpack is a number that can be made to say almost anything. Change the boundary, change the factor, allocate overhead differently, and the same bag can be reported at figures that differ by a factor of two without anyone lying.
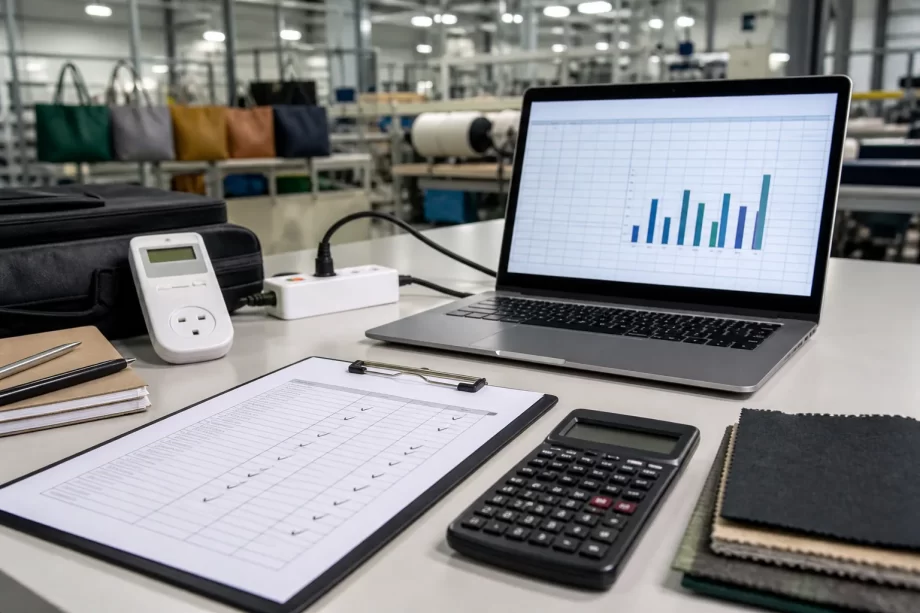
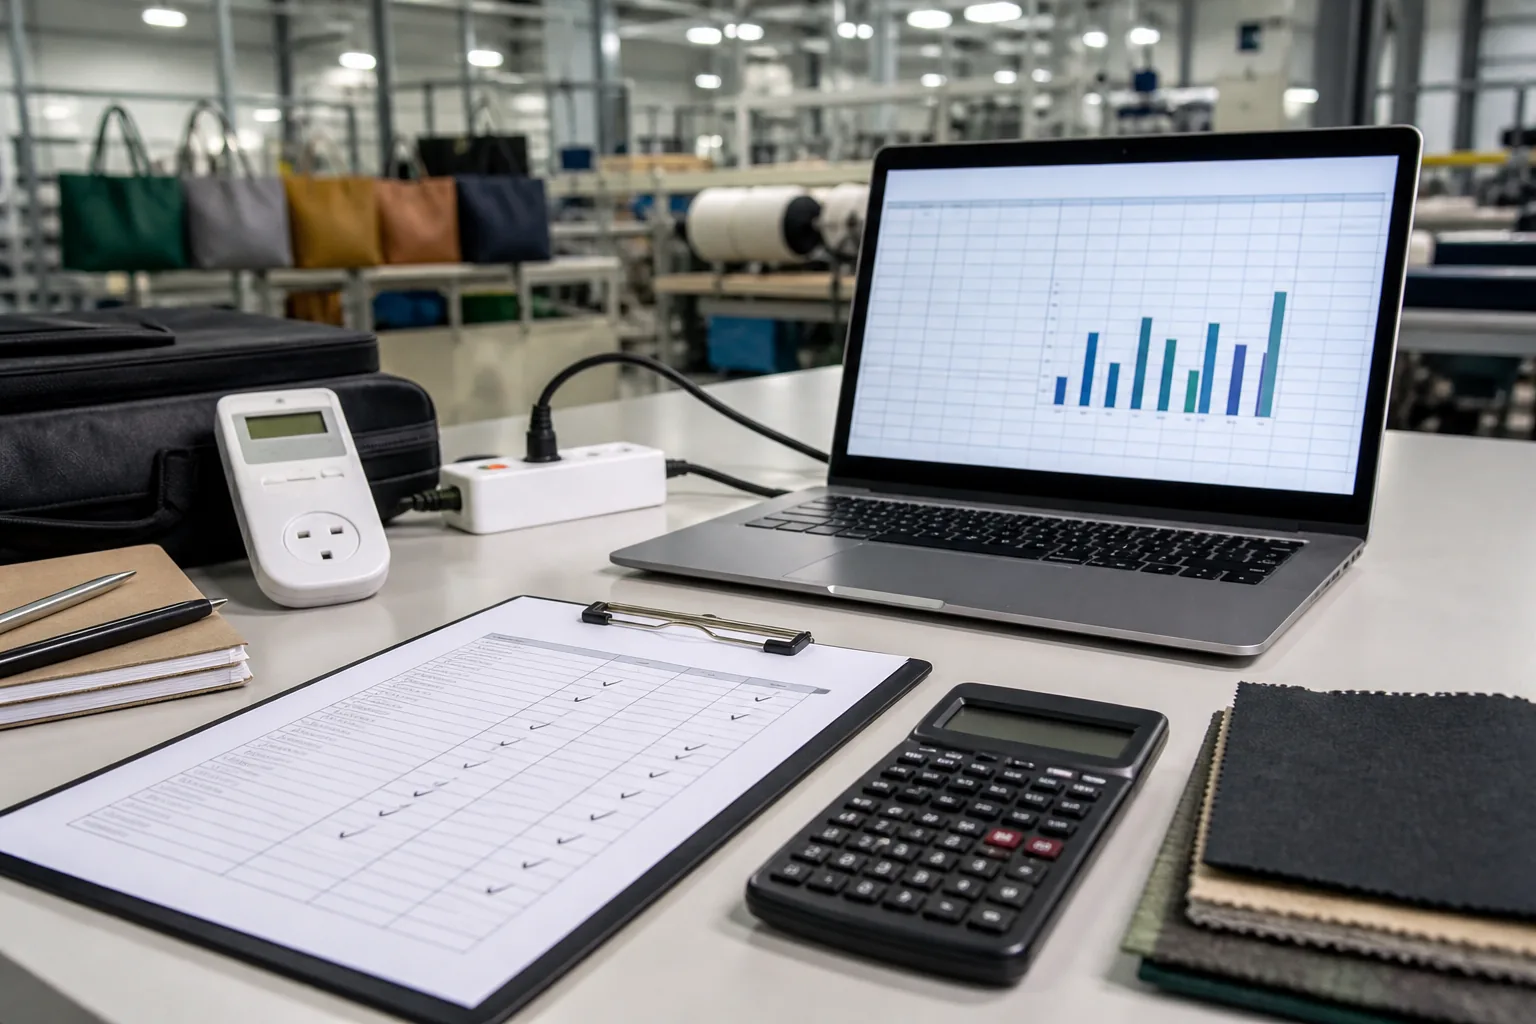
A sustainability engineer’s desk with a laptop chart, a utility meter sheet and a fabric swatch
This guide covers product carbon footprinting from a bag manufacturer’s perspective. It starts with why carbon accounting behaves differently from compliance work, and with the boundary decisions that determine what the number even means.
It then covers how emissions are mapped across a bag, how activity data and emission factors are collected, how the calculation is assembled, how verification works, which reduction levers actually move the result, and how the figure is reported to buyers and regulators.
Compliance has a correct answer that a regulator can check. Carbon accounting has a defensible answer, and defensibility depends on method, documentation, and consistency rather than on a single permitted value.
The Difference Table
Dimension
Compliance
Carbon
Answer
Binary
Numeric
Authority
Regulator
Method standard
Failure
Rejection
Dispute
Evidence
Certificate
Calculation file
Variability
Low
High
Comparison
Exact
Method-dependent
The Method Table
Standard
Scope
Product footprint standard
Single product
Organisational standard
Whole site
Sector guidance
Category rules
Buyer protocol
Customer requirement
National scheme
Market-specific
Internal method
Management use
The Audience Table
Audience
What they want
Buyer
Comparable figure per bag
Retailer
Reduction evidence
Regulator
Method disclosure
Investor
Trend and target
Internal
Hotspot identification
Consumer
Simple claim
The Risk Table
Risk
Consequence
Boundary inconsistency
Figures not comparable
Factor mismatch
Systematic over or understatement
Allocation dispute
Buyer rejection
Undocumented assumption
Claim withdrawn
Rounding and unit error
Credibility loss
Selective reporting
Greenwashing finding
A footprint is only as useful as its method statement. Without one, the number is a marketing figure; with one, it becomes a management tool.
Setting the Boundary
The boundary decides which emissions belong to the bag. Two factories can both claim a cradle-to-gate footprint and include different things, which is why the boundary statement matters more than the total.
The Boundary Table
Boundary
Covers
Cradle to gate
Material to factory exit
Cradle to grave
Adds use and disposal
Gate to gate
Factory operations only
Cradle to customer
Adds distribution
Material only
Upstream materials
Operational
Energy and waste
The Scope Table
Scope
Content
Upstream materials
Fibre, coating, hardware
Inbound transport
Supplier to factory
Factory energy
Electricity and fuel
Process emissions
Coating solvents
Waste
Offcuts and effluent
Outbound
Distribution to customer
The Exclusion Table
Exclusion
Justification
Capital equipment
Below threshold
Employee commuting
Outside product
Office operations
Not attributable
Packaging
Reported separately
Samples and rejects
Small share
Subcontractor transport
Out of control
The Allocation Table
Basis
When used
Mass
Default for materials
Volume
Bulky lightweight goods
Machine hours
Process-intensive work
Labour hours
Manual assembly
Revenue
Multi-product sites
Unit count
Simple lines
The Comparability Table
Decision
Effect on figure
Include inbound freight
Raises total
Exclude packaging
Lowers total
Mass allocation
Favours heavy styles
Machine-hour allocation
Favours light styles
Grid factor choice
Large swing
Recycled content credit
Large swing
Choose the boundary that the buyer will compare against, write it down, and keep it stable across seasons, because a footprint that changes method every year cannot show a trend.
Mapping Emissions Across a Bag
Mapping is the step where the footprint stops being an abstraction. The bag is broken into materials, processes, and movements, and each element is assigned a quantity that can be measured or estimated from records.
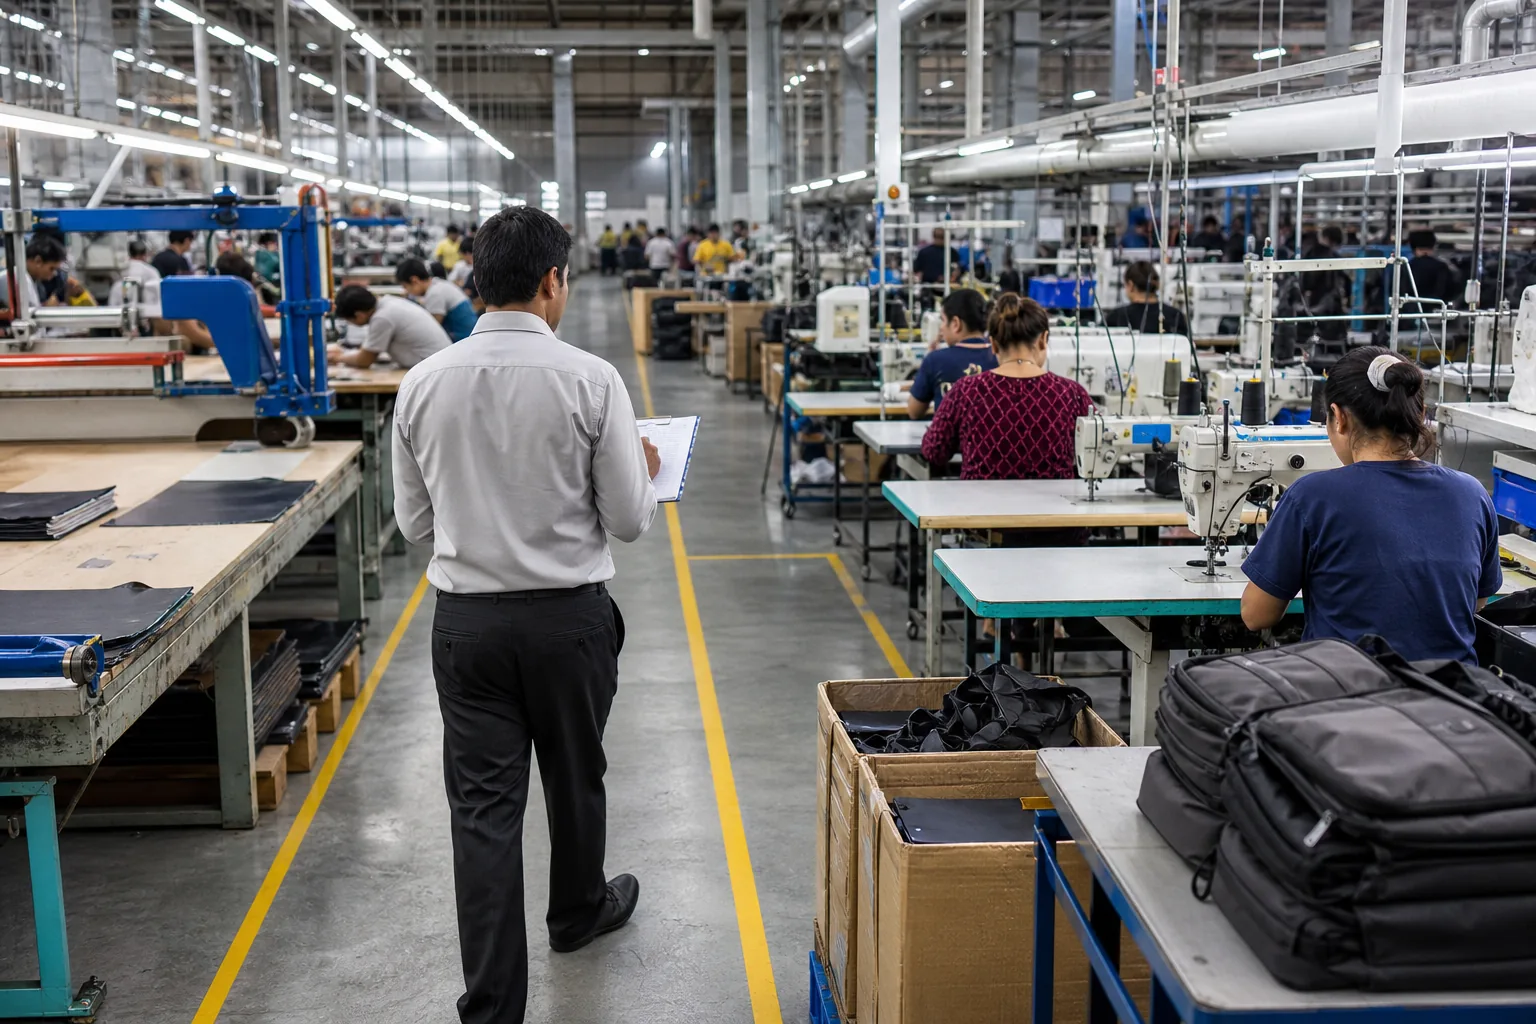
A technician walking the production floor with a clipboard to map process stages
The Material Table
Material
Emission driver
Nylon fabric
Polymer production
Polyester fabric
Polymer and spinning
Coating
Solvent and resin
Foam
Polymer and density
Webbing
Fibre and weaving
Metal hardware
Mining and finishing
The Process Table
Process
Energy driver
Cutting
Machine electricity
Sewing
Motor electricity
Heat sealing
Direct energy
Printing
Drying energy
Embroidery
Machine electricity
Packing
Lighting and handling
The Movement Table
Leg
Mode
Fibre to mill
Road or sea
Mill to coater
Road
Coater to factory
Road or sea
Factory to port
Road
Port to customer
Sea or air
Customer to store
Road
The Hotspot Table
Hotspot
Typical share
Main fabric
Largest single item
Coating
Material and energy
Hardware
Small mass, high intensity
Factory electricity
Site dependent
Air freight
Can dominate
Packaging
Small but visible
Mapping usually reveals that one material and one movement dominate the total, and that the rest of the bag contributes a long tail that is expensive to measure and small in effect.
Data Collection and Emission Factors
A footprint is built from two inputs: how much activity occurred, and what emission factor applies to it. Errors in the first are usually noise; errors in the second are usually bias.
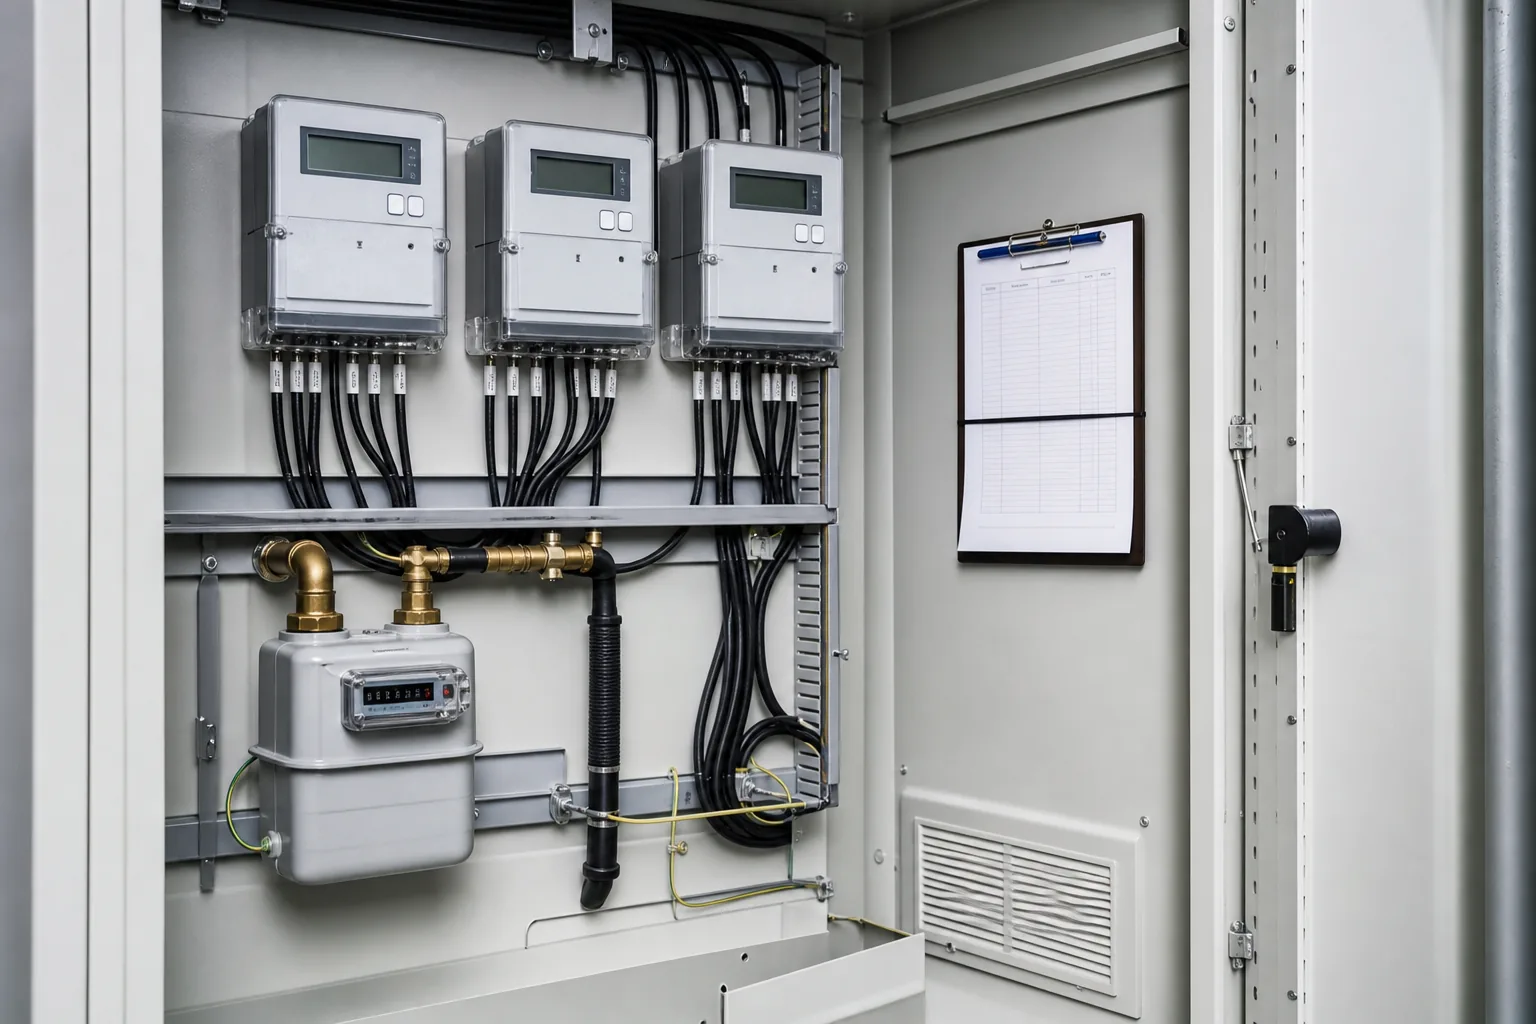
A utility data cabinet with submeters, a gas meter and a clipped logbook
The Activity Table
Data
Source
Fabric consumption
Cut records
Material weight
Specification
Electricity
Meter or bill
Fuel
Purchase records
Freight distance
Shipping documents
Waste quantity
Disposal records
The Quality Table
Level
Basis
Measured
Metered at source
Calculated
Derived from records
Estimated
Proxy or average
Modelled
Industry database
Assumed
Default value
Missing
Gap declared
The Factor Table
Factor type
Character
Supplier-specific
Most accurate
Industry average
Common default
National grid
Market-wide
Regional grid
Sub-national
Database material
Broad coverage
Proxy
Lowest confidence
The Selection Table
Criterion
Requirement
Geography
Matches production
Year
Recent
Technology
Representative
Boundary
Matches scope
Documentation
Published source
Consistency
Same across years
The Unit Table
Error
Effect
kg versus tonnes
Factor of 1,000
kWh versus MWh
Factor of 1,000
Metres versus yards
About 9 percent
Wet versus dry weight
Coating share
Gross versus net
Packaging inclusion
Per unit versus per carton
Order-of-magnitude
The Gap Table
Gap
Handling
No submeter
Allocate by area or hours
No supplier data
Use industry average
No freight record
Estimate from route
No waste data
Apply yield loss
No factor
Declare and exclude
No record at all
Cannot include
The weakest data in the calculation determines the credibility of the total, which is why a declared gap is worth more than an invented value.
Calculation Mechanics
The arithmetic is simple; the discipline is in keeping it traceable. Each line of the calculation should be reproducible by someone else from the same records, without asking the original author what a column meant.
The Formula Table
Element
Expression
Material emissions
Mass multiplied by factor
Process emissions
Energy multiplied by factor
Transport emissions
Tonne-kilometres multiplied by factor
Waste emissions
Mass multiplied by treatment factor
Product total
Sum of all lines
Per-unit figure
Total divided by units
The Structure Table
Layer
Content
Line item
One activity
Category
Material, process, transport
Stage
Upstream, factory, downstream
Product
Style and size
Batch
Production run
Site
Factory total
The Worksheet Table
Column
Purpose
Activity
What was consumed
Quantity
Amount
Unit
Unit of measure
Factor
Value applied
Source
Where the factor came from
Result
Calculated emissions
The Allocation Step Table
Step
Method
Site energy to product
Machine hours or mass
Shared transport to product
Volume or mass
Overhead to product
Labour or revenue
Waste to product
Yield loss
Packaging to product
Unit count
Verify total
Sum back to site
The Rounding Table
Issue
Practice
Intermediate rounding
Keep full precision
Final rounding
Two significant figures
Unit conversion
Convert once, at source
Repeated recalculation
Same rule each year
Reported decimals
Match buyer format
Aggregation
Sum before rounding
The Sensitivity Table
Variable
Influence
Grid factor
High
Fabric mass
High
Freight mode
Very high
Recycled content
High
Allocation basis
Moderate
Packaging
Low
A footprint calculated to four decimal places from estimated inputs is a false precision, and buyers increasingly read the data quality statement before they read the total.
Verification and Assurance
Verification is not an audit of the number, it is an audit of the reasoning. A verifier follows the calculation from the reported total back to records, and the finding is usually about documentation rather than arithmetic.
The Verification Table
Level
Depth
Internal review
Colleague check
Second party
Buyer review
Third party
Independent assurance
Certification
Scheme audit
Limited assurance
Selected lines
Reasonable assurance
Full coverage
The Evidence Table
Claim
Evidence
Material mass
Specification and cut record
Energy consumption
Meter or bill
Factor source
Published database
Allocation method
Written procedure
Boundary
Method statement
Reduction
Baseline and current
The Finding Table
Finding
Typical cause
Missing source
Factor uncited
Inconsistent boundary
Year-on-year drift
Allocation undocumented
No written method
Unit error
Conversion slip
Double counting
Overlapping scopes
Unsupported reduction
Baseline restated
The Method Statement Table
Section
Content
Scope
What is included
Boundary
Where the product starts and ends
Data sources
Records used
Factors
Database and version
Allocation
Basis and rationale
Limitations
Known gaps
The Baseline Table
Requirement
Reason
Representative year
Normal production
Same boundary
Comparability
Documented data
Defensibility
Locked figure
Prevents drift
Restatement policy
Handles corrections
Recalculation trigger
Structural change
Restating a baseline without disclosure is the most common way a reduction claim becomes indefensible, because the improvement is created by moving the starting point.
Reduction Levers That Change the Number
A footprint is only worth calculating if something follows. The levers that move a bag’s figure are limited, and they sit in a predictable order of magnitude.
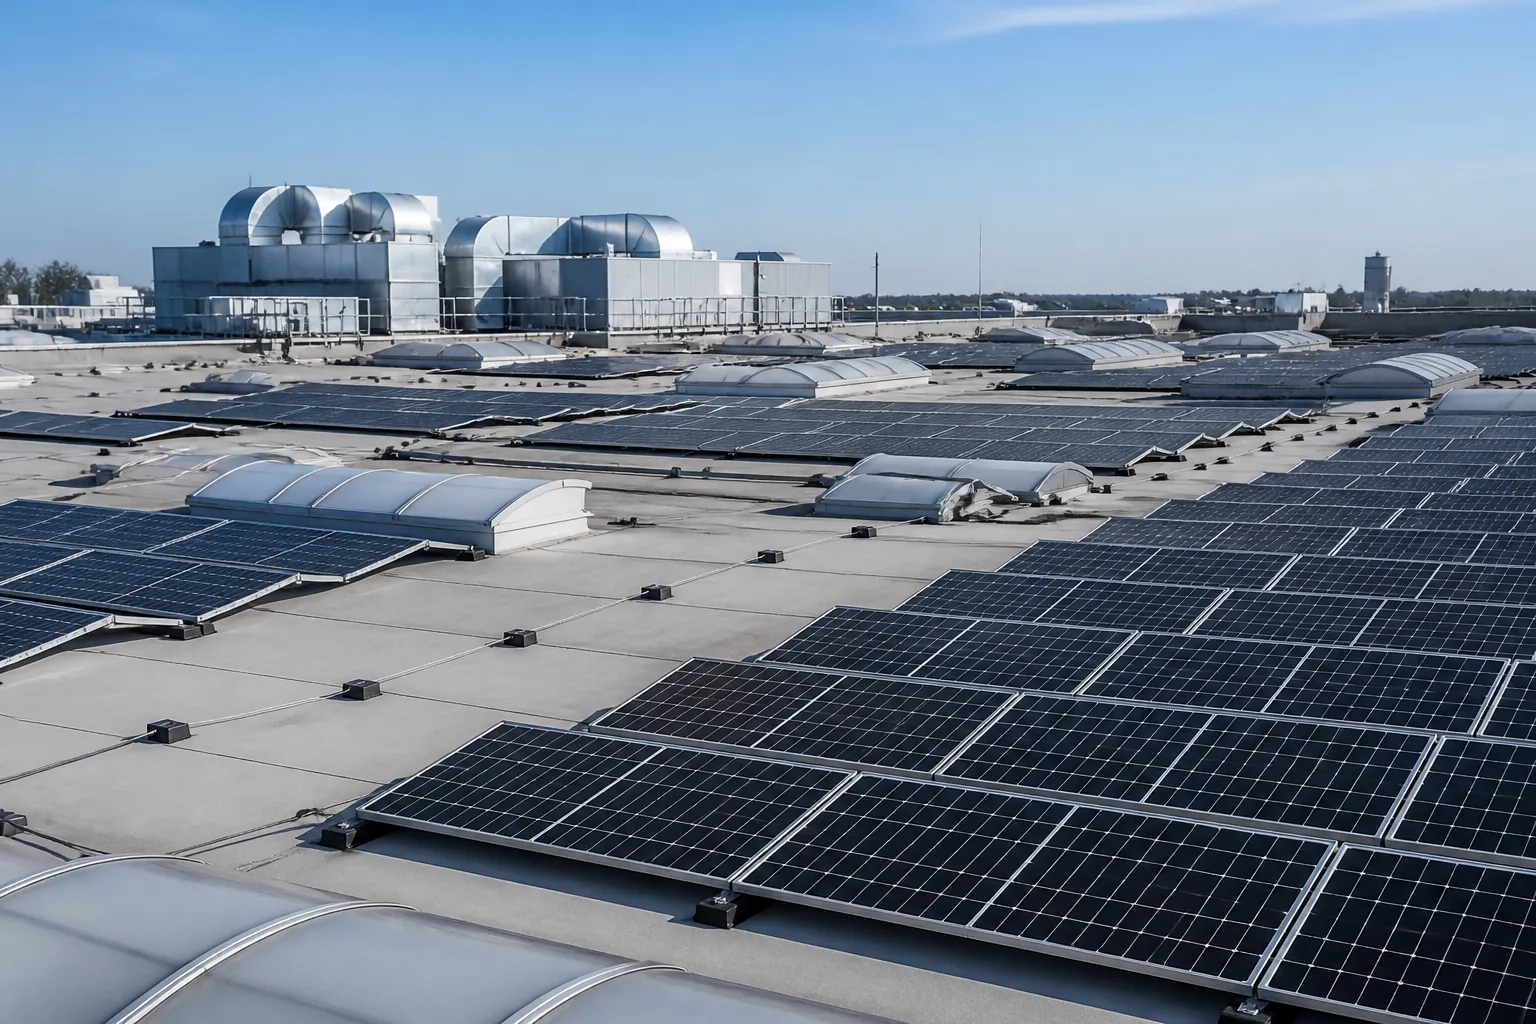
Rooftop solar panels on an industrial factory roof with ventilation units and skylights
The Lever Table
Lever
Magnitude
Fabric selection
Large
Recycled content
Large
Freight mode
Very large
Factory electricity
Moderate
Yield and waste
Moderate
Packaging
Small
The Fabric Table
Choice
Effect
Lower mass fabric
Direct reduction
Recycled feedstock
Large reduction
Single-material design
Easier recovery
Coating reduction
Less chemistry
Local mill
Lower transport
Standard colour
Less dyeing
The Energy Table
Measure
Mechanism
LED retrofit
Lower lighting load
Motor upgrade
Efficient sewing
Compressed air repair
Removes leakage
Solar generation
Lower grid factor
Load scheduling
Avoids peaks
Metering
Visibility and control
The Freight Table
Change
Effect
Air to sea
Very large reduction
Consolidation
Fewer sailings
Carton optimisation
Less volume
Direct routing
Shorter distance
Modal shift to rail
Moderate
Local sourcing
Lower distance
The Waste Table
Source
Control
Cutting offcuts
Marker efficiency
Rejects
First-time quality
Samples
Reuse programme
Packaging
Right-sizing
Chemical waste
Process control
Returns
Repair and resale
The Trade-off Table
Trade-off
Consideration
Lightweight versus durable
Lifetime emissions
Recycled versus performance
Testing needed
Local versus scale
Cost and capacity
Sea versus speed
Working capital
Coating versus weather
Functional need
Single material versus design
Aesthetics
The largest reductions in bag footprints usually come from two decisions that are made outside the factory: what the bag is made of and how it is shipped.
Reporting to Buyers and Regulators
Reporting is where a technical calculation becomes a commercial document. Buyers compare suppliers, and they compare on the basis of the figure and the method statement, not on the effort behind it.
The Report Table
Element
Content
Functional unit
One bag of stated size
Total
Kilograms of carbon dioxide equivalent
Boundary
Stated clearly
Breakdown
By stage
Method
Standard referenced
Data quality
Declared
The Buyer Question Table
Question
Underlying concern
What is the figure per bag
Comparison
What is included
Boundary
Which factors
Methodology
Is it verified
Reliability
What changed since last year
Progress
What is the roadmap
Commitment
The Disclosure Table
Claim type
Requirement
Product footprint
Method statement
Reduction percentage
Locked baseline
Carbon neutral
Offsets disclosed
Net zero target
Scope and date
Recycled content
Traceability
Renewable electricity
Certificates
The Comparison Table
Pitfall
Result
Different functional units
Invalid comparison
Different boundaries
Invalid comparison
Different factor years
Misleading trend
Different allocation
Arbitrary ranking
Estimated versus measured
False precision
Partial scope
Understatement
The Communication Table
Audience
Format
Buyer technical team
Full calculation file
Buyer sourcing team
Summary per style
Retailer compliance
Method statement
Regulator
Prescribed template
Consumer
Simple verified claim
Internal management
Dashboard
A footprint reported without its method statement invites a comparison it cannot survive, and the supplier that supplies the method usually wins the argument about the number.
Footprint Versus Full Life Cycle Assessment
A carbon footprint is one impact category extracted from a life cycle assessment, and confusing the two leads factories to promise studies they are not equipped to deliver.
The Footprint Comparison Table
Aspect
Carbon footprint
Full assessment
Indicators
One
Many
Complexity
Moderate
High
Cost
Lower
Higher
Duration
Weeks
Months
Use
Buyer reporting
Product design
Expertise
Internal possible
Specialist
The Indicator Table
Indicator
Question answered
Carbon
Climate contribution
Water
Scarcity exposure
Eutrophication
Water quality
Acidification
Soil and water
Land use
Habitat pressure
Toxicity
Chemical impact
The Study Scope Table
Study
Typical trigger
Screening footprint
Internal hotspot
Product footprint
Buyer request
Full assessment
Design decision
Comparative study
Marketing claim
Organisational inventory
Corporate report
Verification support
Claim defence
A footprint answers a narrow question well, and a factory that presents it as a full environmental assessment invites a challenge it cannot meet.
Common Calculation Errors
The errors that recur are arithmetic and structural rather than conceptual, and most of them can be caught by a second reader following the file from the total back to the source.
The Error Table
Error
Symptom
Unit conversion
Implausible magnitude
Double counting
Total above site energy
Boundary drift
Year-on-year jump
Factor mismatch
Unexplained change
Missing component
Total below expectation
Allocation change
Ranking shift
The Detection Table
Check
Method
Order of magnitude
Compare to similar styles
Reconciliation
Sum lines to site total
Year comparison
Explain any movement
Unit scan
Read every unit column
Factor audit
Trace each factor
Independent recount
Second reader
The Correction Table
Finding
Action
Arithmetic error
Correct and note
Factor error
Recalculate affected lines
Boundary error
Restate and disclose
Missing data
Add and declare
Allocation change
Apply retroactively
Reporting error
Issue corrected report
The Lesson Table
Practice
Prevents
Template with locked formulas
Arithmetic slips
Source column mandatory
Uncited factors
Reconciliation tab
Double counting
Change log
Undisclosed restatement
Second reader
Blind spots
Version control
Wrong file submitted
A footprint file that cannot be reconciled back to the site’s utility bills is either incomplete or double counted, and the reconciliation is the fastest check available.
Collecting Data From Suppliers
Most of a bag’s emissions sit upstream of the factory, in materials the factory buys rather than processes. That makes supplier data the single largest determinant of footprint quality, and the hardest to obtain.
The Supplier Data Table
Data point
Typical availability
Material composition
Usually available
Mass per unit
On specification
Recycled content
Varies widely
Supplier-specific factor
Rare
Energy source
Occasionally
Transport mode
Sometimes
The Request Table
Element
Specification
Data format
Fixed template
Boundary
Cradle to gate
Factor basis
Published or verified
Reference year
Stated
Confidentiality
Agreement in place
Update cycle
Annual
The Response Table
Response
Interpretation
Verified factor
Highest quality
Published factor
Acceptable
Internal estimate
Declare as estimate
Refusal
Use industry average
Partial data
Combine with proxy
No response
Declare gap
The Leverage Table
Situation
Approach
Large volume
Data in contract
Long relationship
Joint improvement
New supplier
Data at qualification
Small volume
Industry average
Single source
Collaborative study
Multiple sources
Standardised request
A factory that asks every material supplier for the same three numbers, in the same format, once a year, builds a usable dataset within two seasons, and one that asks differently each time builds a folder of incompatible documents.
Targets, Trajectories and Buyer Expectations
A footprint without a target is a report. Buyers increasingly ask for both, and they ask in a form that requires the factory to commit to a trajectory rather than to a single improvement.
The Target Table
Type
Character
Absolute reduction
Total emissions fall
Intensity reduction
Emissions per bag fall
Renewable electricity
Share of supply
Material substitution
Specification change
Supplier engagement
Upstream influence
Net zero
Long-dated commitment
The Trajectory Table
Element
Requirement
Baseline year
Locked and documented
Target year
Credible horizon
Interim milestones
Three to five years
Scope covered
Stated explicitly
Mechanism
Named measures
Review point
Annual
The Buyer Expectation Table
Request
What it tests
Figure per style
Measurement capability
Method statement
Rigour
Reduction plan
Management intent
Verification report
Reliability
Annual update
Consistency
Roadmap to target
Credibility
The Credibility Table
Weak signal
Strong signal
One-off study
Annual series
Percentage without baseline
Stated baseline year
Intensity only
Absolute and intensity
Offsets first
Reduction first
Unverified claim
Third-party assurance
No capital plan
Costed measures
A target that is expressed only as an intensity ratio can improve while total emissions rise, which is why buyers now ask for both figures and read the difference.
Building the Capability
A footprint that lives in one engineer’s spreadsheet disappears when that engineer leaves. The capability has to sit in a procedure, a data habit, and a file structure that survives staff changes.
The Capability Table
Element
Requirement
Owner
Named responsibility
Procedure
Written method
Data habit
Monthly collection
Factor library
Versioned sources
Calculation file
Structured template
Review cycle
Annual refresh
The Data Habit Table
Frequency
Activity
Monthly
Meter readings logged
Monthly
Production volumes recorded
Quarterly
Material consumption reconciled
Quarterly
Freight records compiled
Annually
Factors updated
Annually
Method reviewed
The Tool Table
Tool
Use
Spreadsheet
Small programmes
Footprint software
Multi-product
ERP module
Data integration
Buyer platform
Customer submission
Metering system
Activity data
Document store
Evidence retention
The Competence Table
Skill
Where needed
Method knowledge
Sustainability lead
Data extraction
Production and finance
Factor selection
Sustainability lead
Calculation
Analyst
Verification liaison
Management
Buyer communication
Sales
The factory that can produce a footprint in two weeks from existing records has a capability, and the one that needs two months of excavation has a project.
Handling Buyer-Specific Requests
Different buyers ask for the same underlying information in incompatible formats, and a factory that answers each request from scratch produces figures that cannot be compared with each other.
The Request Type Table
Request
Typical origin
Figure per style
Sourcing comparison
Percentage reduction
Target tracking
Full calculation file
Technical review
Platform submission
Retailer programme
Questionnaire
Compliance team
Roadmap narrative
Category review
The Reuse Table
Element
Reusable
Activity data
Yes, across buyers
Factor library
Yes
Allocation rules
Yes
Method statement
Adapt summary
Reporting format
Rebuild per request
Narrative
Adjust to audience
One calculation file, one factor library, and one method statement can serve every buyer, provided the factory keeps the reporting layer separate from the calculation layer.
Data Systems and Automation
Once a footprint is calculated more than twice, the question changes from how to calculate it to how to keep it current without rebuilding it each time. That is a data architecture problem rather than a sustainability problem.
The Source Table
Source system
Data supplied
ERP
Production volumes and orders
Cutting system
Fabric consumption
Metering
Electricity and fuel
Finance
Utility invoices
Logistics
Freight legs and modes
Procurement
Material specifications
The Integration Table
Approach
Character
Manual export
Simple, error-prone
Scheduled extract
Reliable, needs mapping
Direct query
Current, needs access
Spreadsheet link
Flexible, fragile
Software import
Structured, costly
No integration
Rebuild each cycle
The Mapping Table
Field
Requirement
Style identifier
Matches ERP
Material code
Matches specification
Quantity
Consistent unit
Period
Matches reporting year
Site
Distinguishes plants
Unit conversion
Applied once
The Automation Table
Task
Automatable
Meter data capture
Yes
Consumption calculation
Yes
Factor application
Yes with library
Allocation
Yes with rules
Method statement
No
Interpretation
No
Automating the arithmetic frees the analyst to work on the parts that decide the number, which are the boundary, the factors, and the allocation rules.
Footprinting a New Style Before Production
The most useful moment to calculate a footprint is before the style exists, because that is when the specification can still change. A footprint produced after bulk production is a report; one produced at development is a design input.
The Stage Table
Stage
Calculation depth
Concept
Material screening
Specification
Estimated footprint
Sampling
Refined with actual masses
Pre-production
Full cradle-to-gate
Bulk
Actual consumption
Repeat order
Confirmed figure
The Screening Table
Decision
Footprint effect
Fabric type
Large
Fabric mass
Large
Coating system
Moderate
Hardware quantity
Moderate
Carton size
Small
Freight assumption
Very large
The Design Lever Table
Lever
When available
Material substitution
Concept and specification
Mass reduction
Concept and specification
Trim simplification
Specification
Panel efficiency
Pattern stage
Packing density
Pre-production
Mode selection
Order stage
A specification meeting that includes a material footprint estimate changes more emissions than a year of operational reporting, because the decisions are still open.
The Footprinting Checklist
Scope
Item
Done
Functional unit defined
☐
Boundary stated
☐
Standard selected
☐
Exclusions listed
☐
Allocation basis documented
☐
Buyer requirement confirmed
☐
Data
Item
Done
Material masses from specification
☐
Consumption from cut records
☐
Energy from meters or bills
☐
Freight from shipping documents
☐
Waste from disposal records
☐
Data quality declared
☐
Calculation
Item
Done
Factors sourced and versioned
☐
Units converted at source
☐
Lines traceable to records
☐
Allocation applied consistently
☐
Totals reconciled to site
☐
Sensitivity tested
☐
Reporting
Item
Done
Method statement written
☐
Breakdown by stage included
☐
Baseline locked
☐
Reduction claims evidenced
☐
Verification arranged
☐
Buyer format matched
☐
FAQ
What does a backpack carbon footprint actually measure?
It measures the greenhouse gases emitted to produce and deliver one bag, expressed as a mass of carbon dioxide equivalent so that different gases can be added together. For a typical cradle-to-gate study that means the emissions embedded in the fabric, coating, foam, webbing and hardware, plus the energy used in cutting, sewing, heat sealing and packing, plus the transport that moved each material to the factory. Whether distribution, use and disposal are included depends on the boundary chosen, which is why the functional unit and boundary statement have to be read together with the total. A figure without those two elements cannot be compared with anything.
Which stage usually dominates a bag’s footprint?
Materials, and within materials the main shell fabric and its coating. A bag is light for its volume, so the mass of textile is moderate, but textile production is emissions-intensive per kilogram and the coated fabric used for the body often carries both the polymer footprint and the energy of the coating process. Hardware contributes a small share by mass but a disproportionate share by intensity, which matters for styles with heavy metal trim. Factory electricity is usually the next largest item after materials. Freight can dominate in specific cases, essentially whenever a meaningful portion of an order moves by air.
How accurate is a product carbon footprint?
Accurate enough to compare options and manage hotspots, and rarely accurate enough to defend a precise claim. The dominant uncertainty usually comes from emission factors rather than from activity data: a grid factor, a material factor, or a supplier-specific value can shift the total by a margin far larger than any metering error. A well-run calculation declares its data quality per line, states which factors were used, and reports the figure with an indication of uncertainty. A footprint presented to three decimal places from estimated inputs is a false precision, and buyers increasingly ask for the data quality statement before they look at the total.
Should recycled content be counted as zero emissions?
No, and the treatment is one of the most contested areas in footprinting. Recycled feedstock avoids some of the upstream burden of virgin polymer, but collection, sorting, cleaning and re-pelletising all consume energy and produce emissions, and the credit depends on the allocation method chosen. The defensible approach is to use a published factor for the recycled material that reflects its actual production chain, state the method in the footprint report, and avoid presenting recycled content as a free reduction. Claiming zero is a shortcut that survives internal reporting and fails at verification.
How should factory overhead be allocated across styles?
With a written method applied consistently, and with the method disclosed. Mass is the common default and is defensible for material-dominated products, but it disadvantages heavy styles and flatters light ones. Machine hours or labour hours allocate process energy more faithfully but require reliable time records. Revenue-based allocation is easy and usually the least defensible for a product footprint, because price does not track emissions. Whichever basis is chosen, the practical requirement is stability: the same method applied to the same boundary across years, so that a change in the figure reflects a change in performance rather than a change in accounting.
What is the fastest way to reduce a reported footprint?
In most bag programmes the two largest and quickest levers sit outside the sewing floor: switching a portion of volume from air to sea freight, and reducing the mass or changing the feedstock of the main fabric. Freight mode can change a style’s figure by an order of magnitude for the affected units, and a fabric specification change applies to every unit in the run. Factory energy measures are worthwhile and usually smaller in effect, and they tend to be limited by capital availability rather than by opportunity. Packaging reductions are visible to buyers but contribute a small share of the total, which is why they should not be the first investment.
Do we need third-party verification?
It depends on who is asking and what is being claimed. An internal management footprint used to prioritise hotspot reductions needs no external assurance, only a documented method. A figure submitted to a buyer for supplier comparison increasingly needs at least a second-party review and often independent verification, because the buyer is making a sourcing decision on it. A public claim, particularly one involving carbon neutrality or a specific percentage reduction, generally requires third-party assurance and a disclosed method. The practical sequence is to build the calculation and the method statement first, verify once the method is stable, and avoid verifying a method that is still changing.
How often should the footprint be recalculated?
Annually as a minimum, and whenever a structural change occurs. Structural changes include a new material or supplier, a change of production site, a significant shift in freight mode, an update to the emission factor set, and any change to the boundary or allocation method. Recalculating on a fixed annual cycle keeps the trend comparable, while recalculating after structural change keeps the figure honest. The important discipline is the baseline: it is locked at the start, a restatement policy is written in advance, and any restatement is disclosed with its reason, because an undisclosed baseline change is the most common way a reduction claim becomes indefensible.
Conclusion
A backpack carbon footprint is a management instrument disguised as a compliance document. The number itself is less important than the structure behind it: a stated boundary, a mapped set of activities, sourced factors, a traceable calculation, and a method statement that lets someone else reproduce the result.
The factories that handle this well do four things consistently. They fix the functional unit and the boundary before they calculate anything, and they keep them stable across years. They collect activity data monthly rather than reconstructing it annually, so the calculation is an assembly rather than an excavation.
They build a versioned factor library and cite every value, because factor choice is where most of the error and nearly all of the argument lives. And they write the method statement as they go, so that verification becomes a review rather than a negotiation.
The reduction levers that follow from the analysis are usually not the ones factories expect. Fabric mass and feedstock, and freight mode, tend to dominate the total, while the operational measures that are easiest to implement are moderate in effect. That is not an argument against operational improvement; it is an argument for measuring first, so that investment goes where the number actually moves.
For buyers, the practical questions are what the functional unit is, what the boundary includes, which factor set was used, how the data quality was declared, and whether the baseline has been restated. A supplier that answers those five has a footprint. A supplier that answers with a total alone has a figure, and a figure without a method is a claim waiting to be disputed.