Factory Solar and Renewable Power: What Payback Should You Expect?
Factory Solar and Renewable Power: What Payback Should You Expect?
Solar payback figures for factories span such a wide range that they are almost meaningless without context. The same roof can be quoted at three years by one installer and nine years by another, and both can be arithmetically correct.
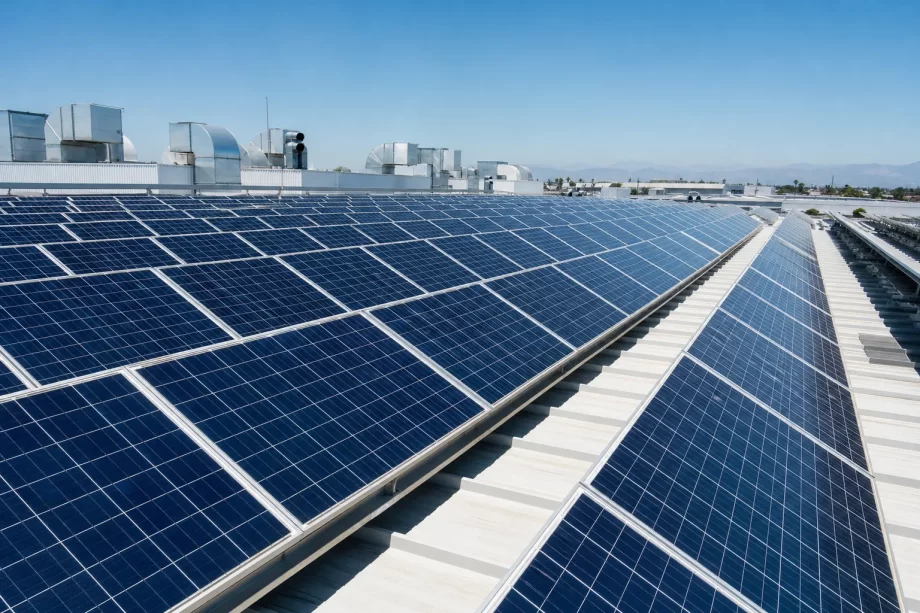
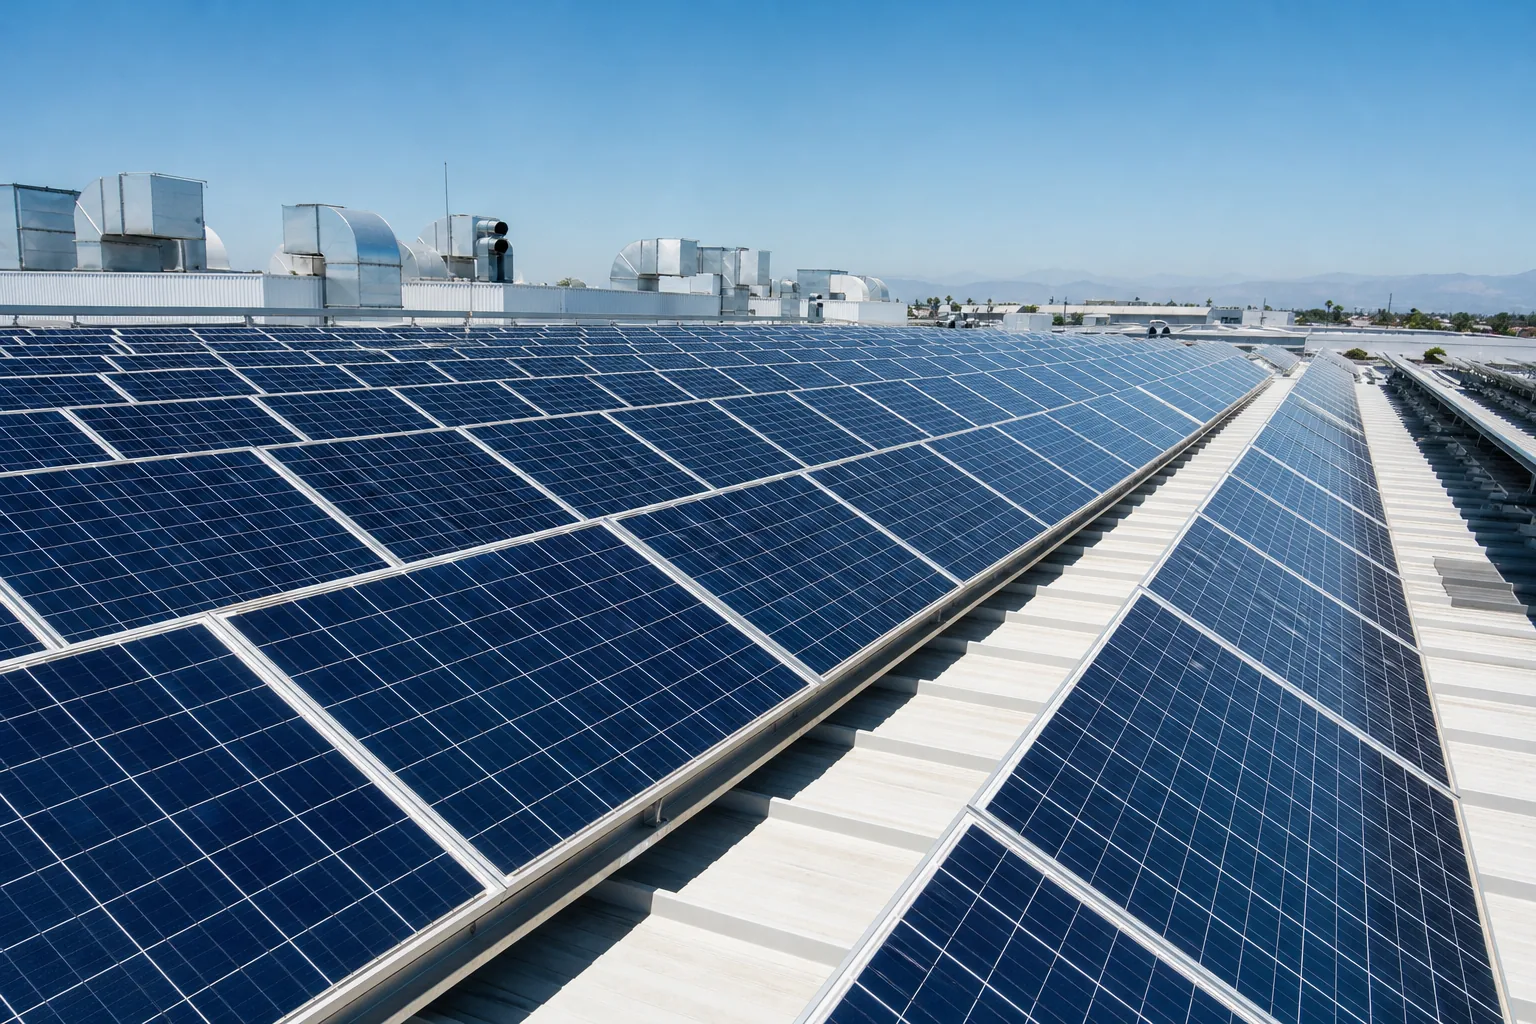
Solar panel array covering an industrial factory rooftop in clear daylight
The difference comes from what each calculation assumes about self-consumption, tariff structure, operating hours, export rules and financing. A payback figure is not a property of a solar array; it is a property of the array plus the load it serves plus the contract it operates under.
This guide sets out how a bag factory should build its own payback number, which inputs actually move the result, and where the common errors sit. It covers sizing, self-consumption, tariff value, financing, grid limits, storage, certificates, roof constraints, and the operating discipline that decides whether the modelled figure survives contact with year three.
The perspective is that of a manufacturing plant with stitch-and-cut operations, a fabric warehouse, compression and heat-sealing equipment, and a load profile that peaks during the working day.
The variation is not usually dishonest. It comes from four assumptions that different parties treat differently, and each one can shift the result by a year or more.
The Payback Assumption Table
Assumption
Effect on payback
Self-consumption rate
Large
Tariff value
Large
Capital cost
Large
Export price
Moderate
Degradation rate
Small
Maintenance cost
Small
The Perspective Table
Party
Natural bias
Installer
Optimistic yield
Utility
Conservative export
Lender
Conservative revenue
Buyer
Wants a number
Factory engineer
Wants a model
Auditor
Wants evidence
The Yield Table
Factor
Influence
Irradiance
Site specific
Panel orientation
Significant
Tilt angle
Moderate
Shading
Can be severe
Soiling
Moderate
Temperature
Reduces output
The Load Table
Load type
Timing
Sewing machines
Day shift
Cutting equipment
Day shift
Compressors
Continuous
Heat sealing
Day shift
Lighting
Extended
Warehouse cooling
Day and night
The Honesty Table
Statement
Reliability
Simple payback
Indicative only
Discounted payback
Better
Levelised cost
Best comparison
Internal rate of return
Useful for finance
Annual saving
Needs tariffs
Payback in years
Needs all inputs
A payback quoted without the self-consumption assumption behind it is not a forecast; it is a marketing number that happens to be arithmetically consistent.
Sizing the Array to the Load
The array should be sized to the daytime load it can actually serve, not to the roof area available or to a round number of kilowatts.
The Sizing Input Table
Input
Source
Annual consumption
Utility bills
Daytime share
Interval data
Peak demand
Meter records
Roof area
Site survey
Structural capacity
Engineering report
Grid limit
Utility approval
The Ratio Table
Array to load ratio
Consequence
Small
High self-consumption
Matched to daytime
Balanced
Slightly oversized
Some export
Twice daytime
Heavy export
Roof-filling
Export dominated
Load-following
Best economics
The Interval Data Table
Data
Interval
Consumption
Fifteen minutes
Demand
Fifteen minutes
Production
Hourly
Irradiance
On-site sensor
Temperature
Ambient
Power factor
Continuous
The Constraint Table
Constraint
Practical effect
Roof condition
Repairs first
Point loading
Structural review
Access routes
Installation cost
Cable distance
Voltage drop
Inverter location
Heat and space
Fire separation
Layout limits
The Sizing Decision Table
Situation
Recommendation
Single day shift
Match daytime load
Two shifts
Larger array viable
Continuous process
High self-consumption
Seasonal demand
Accept export
Rented building
Check tenure first
Expansion planned
Size for future load
Size the array against the load curve, not the roof, because a roof-filling array on a single-shift plant exports most of its output at the price the utility decides, not the price the factory pays.
Self-Consumption and Load Matching
Self-consumption is the single most important number in a factory solar model, because a kilowatt-hour used on site displaces a purchased kilowatt-hour at the full retail value, while an exported one earns whatever the grid will pay.
The Self-Consumption Table
Rate
Interpretation
Above 85%
Excellent match
70 to 85%
Good
50 to 70%
Workable
30 to 50%
Export heavy
Below 30%
Poor economics
Near zero
No daytime load
The Matching Table
Load pattern
Match quality
Single day shift
Strong
Two day shifts
Strong
Three shifts
Moderate
Weekend shutdown
Weekly dips
Seasonal production
Variable
Continuous process
Stable
The Improvement Table
Measure
Effect
Shift load to midday
Raises self-use
Stagger compressor starts
Smooths demand
Pre-cool warehouse
Uses midday output
Schedule cutting
Aligns with production
Battery storage
Shifts surplus
Reduce standby load
Lowers baseline
The Profile Table
Hour
Typical plant behaviour
Early morning
Low base load
Start-up
Demand spike
Mid-morning
Peak production
Midday
Peak solar overlap
Afternoon
Falling solar
Evening
Base load only
The Monitoring Metric Table
Metric
Why it matters
Self-consumption ratio
Directly drives savings
Export volume
Lower value
Curtailment
Lost generation
Peak demand
Capacity charges
Load factor
Utilisation
Solar fraction
Buyer reporting
Self-consumption is a production scheduling decision as much as an engineering one, and moving a high-load operation by two hours can raise it more than adding panels.
Tariffs and the Value of a Kilowatt-Hour
The value of solar output depends on the tariff structure it displaces, and factory tariffs are rarely a single flat rate.
The Tariff Table
Component
Behaviour
Energy charge
Per kilowatt-hour
Demand charge
Per kilowatt peak
Time-of-use rate
Varies by hour
Seasonal rate
Varies by month
Power factor charge
Penalty or bonus
Fixed charge
Unavoidable
The Displaced Unit Table
Displaced unit
Value
Daytime energy charge
Full retail
Peak period energy
Highest
Demand charge reduction
Possible
Power factor penalty
Avoidable
Exported unit
Export rate
Curtailed unit
Zero
The Demand Table
Situation
Effect
Solar reduces peak
Demand charge falls
Solar peaks after demand
No effect
Battery clips peak
Demand charge falls
Start-up spike remains
No change
Coincident peak
Valuable
Non-coincident
Limited
The Rate Table
Structure
Solar advantage
Flat rate
Moderate
Time-of-use
Strong at midday
Demand heavy
Strong if coincident
Seasonal summer peak
Strong
Low energy price
Weak
High export penalty
Weak
The Calculation Table
Element
Formula
Self-used units
Generation times ratio
Export units
Generation minus self-use
Energy saving
Units times rate
Demand saving
Peak reduction times charge
Export income
Units times export rate
Gross benefit
Sum of the above
Check whether the site’s peak demand actually coincides with solar production, because many factories peak at start-up before the array is generating anything.
Building the Payback Calculation
A payback model is a small number of inputs multiplied together, and most disagreements come from two of them rather than from the arithmetic.
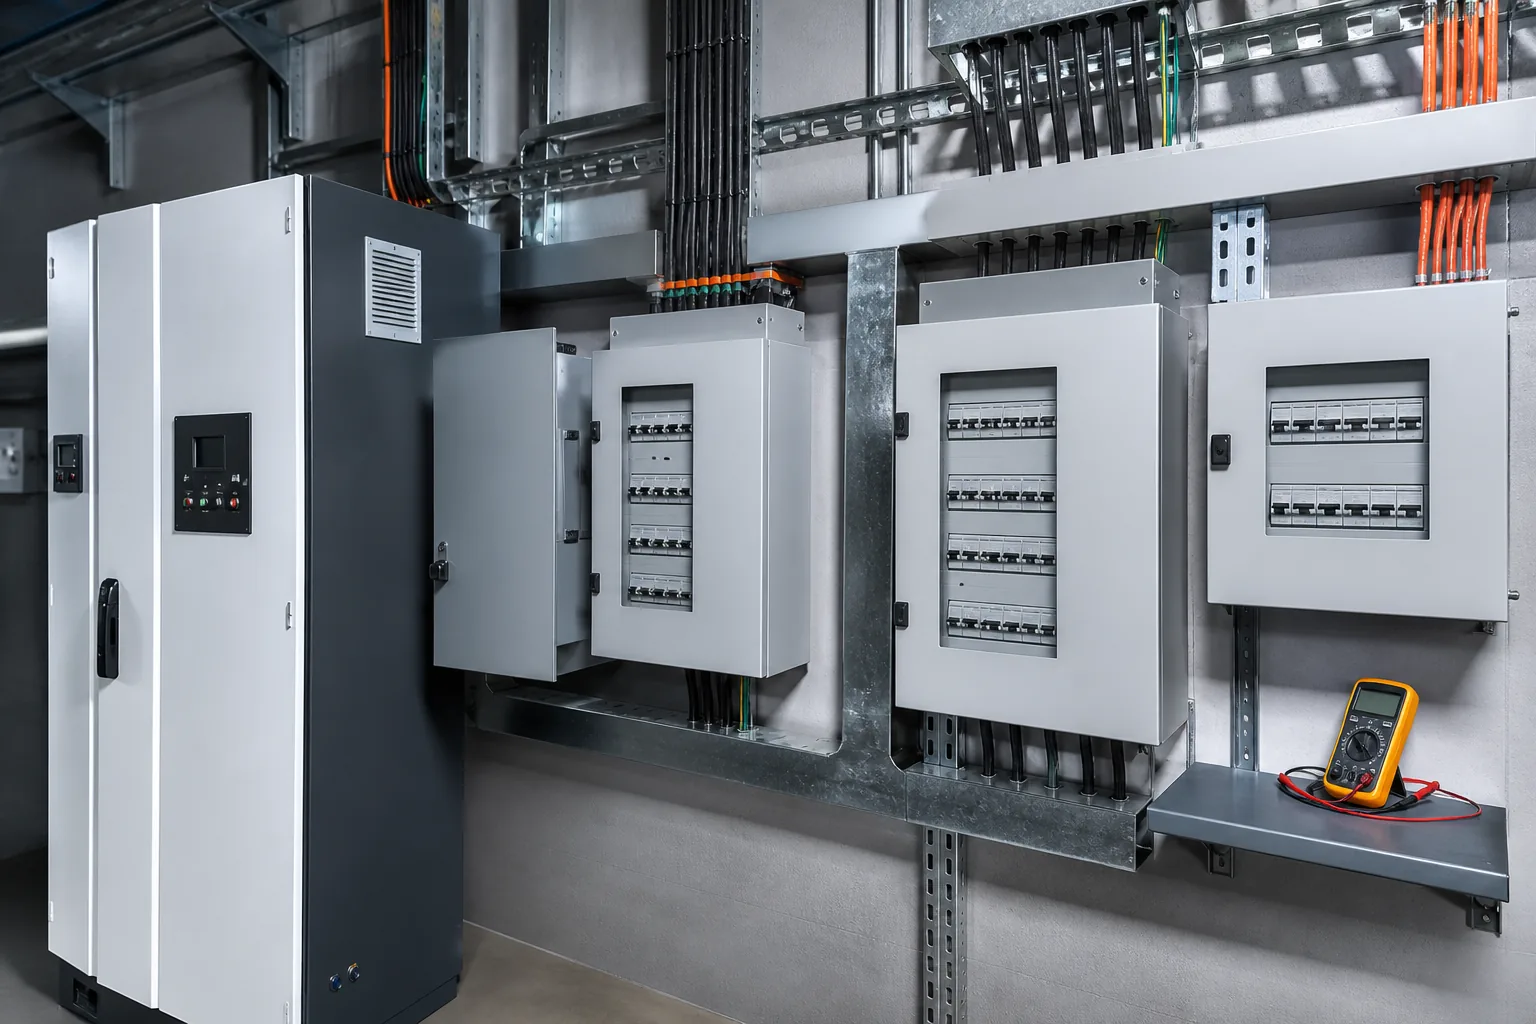
Inverter cabinet and distribution boards in a factory electrical room
The Input Table
Input
Typical source
Installed cost
Quotation
Annual yield
Simulation
Self-consumption
Interval data
Retail tariff
Utility bill
Export rate
Contract
Degradation
Manufacturer data
The Capital Cost Table
Cost element
Share
Modules
Largest
Inverters
Significant
Mounting structure
Significant
Cabling and switchgear
Moderate
Installation labour
Moderate
Design and approval
Small
The Benefit Table
Benefit
Included
Energy savings
Yes
Demand savings
If proven
Export income
If contracted
Certificate income
If applicable
Maintenance cost
As negative
Insurance change
As negative
The Result Table
Metric
What it tells you
Simple payback
Rough screening
Discounted payback
Time to recover value
Net present value
Absolute gain
Internal rate of return
Comparison with alternatives
Levelised cost
Cost per unit generated
Sensitivity range
Confidence
The Sensitivity Table
Variable
Impact
Self-consumption
Very high
Installed cost
High
Retail tariff
High
Yield
Moderate
Export rate
Moderate
Degradation
Low
Build the model with a range on self-consumption rather than a single figure, because that is the input a factory controls and the one most often assumed rather than measured.
Financing Structures and Who Owns the Array
Who pays for the array changes the payback calculation entirely, and a factory comparing a purchased system with a leased one is comparing two different financial products.
The Ownership Table
Structure
Owner
Direct purchase
Factory
Bank loan
Factory, financed
Operating lease
Lessor
Power purchase agreement
Third party
Energy service contract
Provider
Group scheme
Shared entity
The Financing Comparison Table
Structure
Cash upfront
Purchase
Full
Loan
Partial
Lease
Low
Power agreement
None
Service contract
None
Group scheme
Shared
The Return Table
Structure
Factory benefit
Purchase
Full savings
Loan
Savings minus interest
Lease
Savings minus rent
Power agreement
Discount to tariff
Service contract
Fixed rate
Group scheme
Allocated share
The Risk Bearer Table
Structure
Risk bearer
Purchase
Factory
Loan
Factory
Lease
Lessor
Power agreement
Provider
Service contract
Provider
Group scheme
Shared
The Decision Table
Situation
Sensible structure
Strong balance sheet
Purchase
Capital constrained
Loan or lease
Rented building
Power agreement
Short tenure
Power agreement
High internal hurdle
Power agreement
Long-term owner
Purchase
A power purchase agreement usually shows a faster payback because the factory invests nothing, but the total saving over twenty years is lower, and the two figures should never be presented as if they were the same metric.
Grid Connection and Export Limits
The grid connection is where many factory solar projects meet their first hard constraint, and it is usually discovered late because it sits outside the installer’s scope.
The Grid Approval Table
Step
Authority
Feasibility enquiry
Network operator
Application
Network operator
Technical review
Network operator
Protection settings
Operator and installer
Inspection
Local authority
Connection offer
Contract
The Limit Table
Constraint
Effect
Export capacity
Caps array size
Reverse power protection
Blocks export
Transformer rating
Limits total
Voltage rise
Limits at feeder end
Protection settings
Must be changed
Metering
Requires upgrade
The Connection Cost Table
Item
Who pays
Network upgrade
Usually developer
Meter change
Site
Protection relay
Site
Cable upgrade
Site
Study fee
Site
Inspection
Site
The Option Table
Approach
Trade-off
Export limited
Smaller array
Zero export
No export income
Curtailment control
Lost generation
Storage added
Higher capital
Demand management
Operational effort
Deferred connection
Lost time
The Timing Table
Stage
Typical duration
Enquiry
Weeks
Application
Weeks to months
Technical review
Months
Upgrade works
Months
Inspection
Weeks
Approval
Weeks
Apply for the connection before ordering modules, because an array that cannot be connected is a warehouse full of glass and a payback calculation that no longer applies.
Storage and Load Shifting
Battery storage is often proposed as the fix for low self-consumption, and it can be, but the economics are driven by the spread between what the stored unit cost and what it displaces.
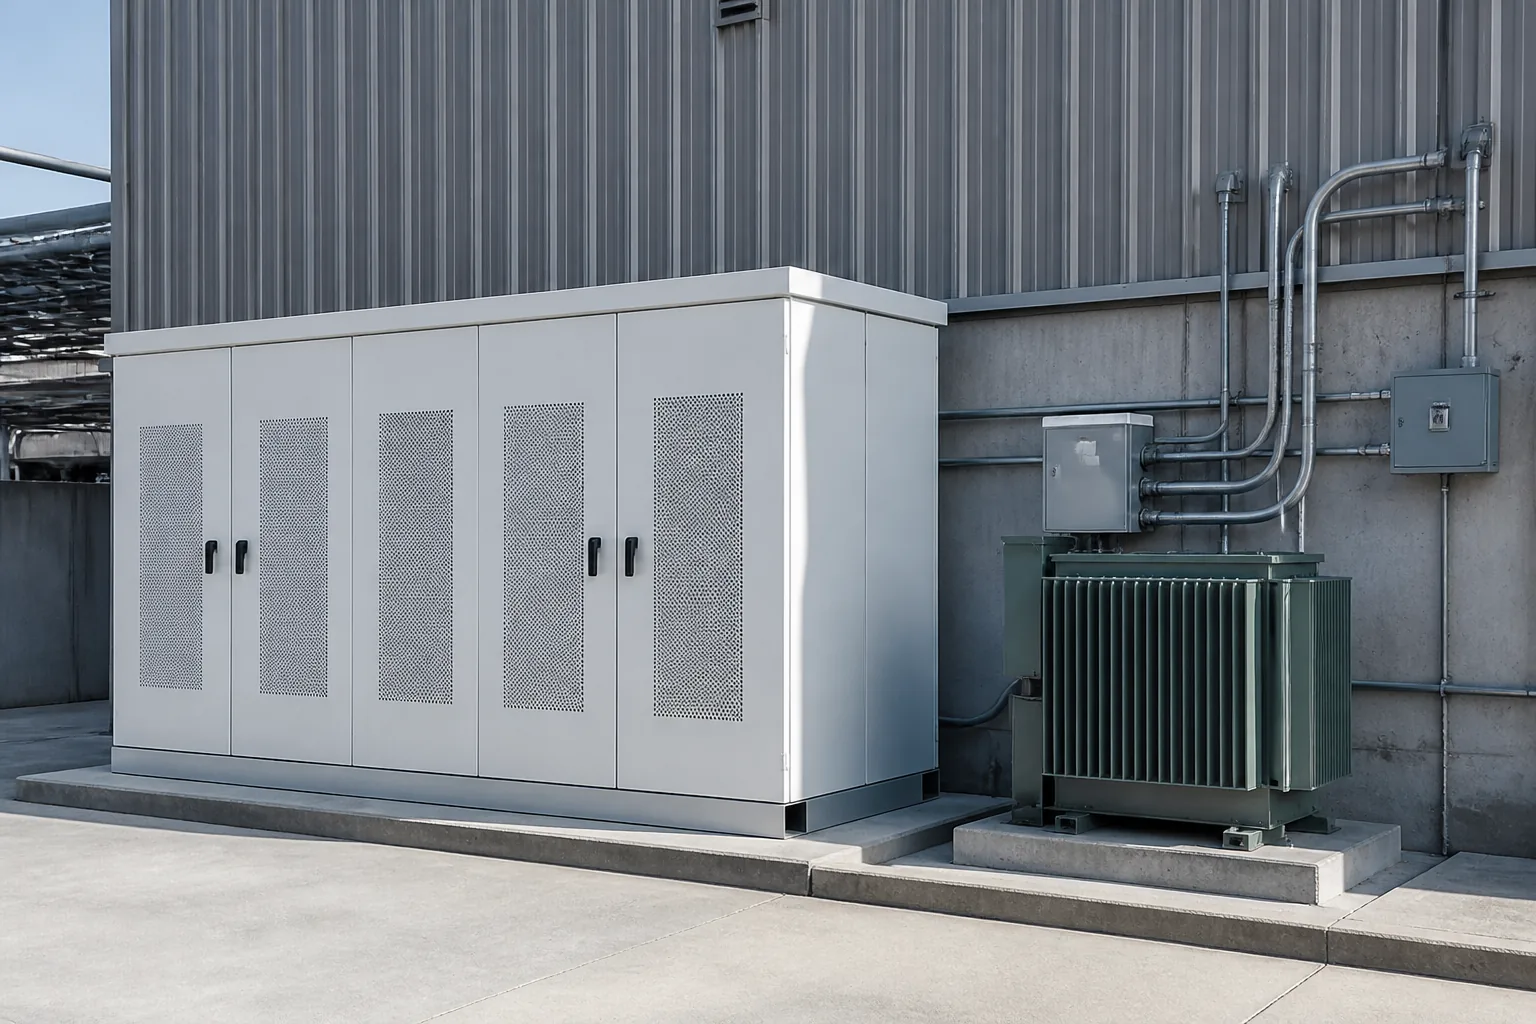
Battery energy storage cabinet installed beside a factory wall
The Storage Service Table
Service
Revenue or saving
Solar shifting
Retail tariff avoided
Peak clipping
Demand charge avoided
Time-of-use arbitrage
Rate spread
Backup
Continuity value
Export avoidance
Export rate forgone
Frequency services
Market dependent
The Storage Sizing Table
Parameter
Consideration
Capacity
Evening load covered
Power rating
Peak shaving depth
Cycle life
Warranty and cost
Round-trip efficiency
Losses
Depth of discharge
Usable energy
Footprint
Site space
The Storage Cost Table
Element
Share
Cells
Largest
Enclosure and cooling
Significant
Inverter and controls
Significant
Installation
Moderate
Safety systems
Moderate
Maintenance
Ongoing
The Economics Table
Case
Battery case strength
High evening load
Strong
Demand charge heavy
Strong
Flat tariff
Weak
High export value
Weak
Unreliable grid
Strong
Short cycles needed
Moderate
The Discipline Table
Practice
Purpose
Measure before sizing
Avoid oversizing
Model cycles per year
Justify life
Include efficiency loss
Realistic saving
Plan for degradation
End-of-life capacity
Check fire requirements
Approval risk
Contract maintenance
Uptime
Storage does not create value by itself; it moves a unit of energy from a moment when it is worth little to a moment when it is worth more, and the spread between those two moments is the entire business case.
Renewable Certificates and Buyer Requirements
A solar array produces two things a bag factory can sell: electricity and a documented renewable attribute, and buyers increasingly ask for the second one in a form they can audit.
Engineer reviewing an energy monitoring dashboard beside a printed chart
The Instrument Table
Instrument
What it evidences
On-site generation
Physical output
Renewable certificate
Attribute of a unit
Contract for difference
Price stability
Green tariff
Purchased attribute
Self-declaration
Weak evidence
Audit report
Verification
The Buyer Request Table
Request
Typical form
Renewable electricity share
Percentage
Carbon reduction
Tonnes avoided
Site generation proof
Meter data
Certificate retirement
Serial numbers
Annual disclosure
Report
Verification
Third party
The Allocation Table
Basis
Method
Location based
Grid average
Market based
Contracts and certificates
Site specific
Direct generation
Residual mix
Unclaimed remainder
Dual reporting
Both disclosed
Estimated
Not acceptable
The Evidence Document Table
Document
Purpose
Generation meter log
Output record
Inverter export
Cross check
Certificate register
Ownership trail
Retirement statement
Claim support
Utility bill
Consumption basis
Audit letter
Assurance
The Claim Table
Wording
Risk
Powered by renewables
Overstated unless matched
100% renewable electricity
Needs full matching
Solar generated on site
Defensible with data
Carbon neutral
Separate claim, avoid conflating
Renewable share
Precise and defensible
Green factory
Undefined, avoid
Keep generation data and certificate records in the same system as the energy bills, because a buyer asking for a renewable percentage will also ask how it was calculated.
Roof, Structure and Site Constraints
The building decides much of the project before the electrical design begins, and roof condition is the constraint that most often delays a scheme by a year.
The Roof Table
Type
Suitability
Standing seam metal
Excellent
Trapezoidal metal
Good with brackets
Concrete flat
Good with ballast
Aged membrane
Repair first
Asbestos sheet
Removal required
Skylight heavy
Reduced area
The Structural Check Table
Check
Concern
Point loading
Local reinforcement
Wind uplift
Fixing design
Snow load
Additional weight
Seismic
Bracing
Corrosion
Coastal sites
Drainage
Water pooling
The Site Table
Factor
Effect
Shading from buildings
Yield loss
Chimney position
Layout constraint
Crane access
Installation cost
Cable route
Voltage drop
Inverter location
Thermal limits
Security
Theft risk
The Interference Table
Issue
Mitigation
Roof warranty void
Written consent
Future re-roofing
Plan removal
Ventilation conflict
Relocate units
Fire access
Keep clear zones
Lightning protection
Bonding design
Working at height
Method statement
The Lifetime Table
Element
Expected life
Modules
Long
Inverters
Medium, replace once
Mounting
Long
Cabling
Long
Roof covering
Often shorter
Warranty cover
Varies
Check the remaining life of the roof before mounting anything on it, because replacing a roof under an operating array costs far more than replacing it before installation.
Monitoring, Degradation and Maintenance
A payback model assumes the array produces what it was designed to produce for twenty years. That assumption survives only if somebody is watching the output and acting on the deviation.
The Monitoring Table
Metric
Frequency
Generation
Daily
Specific yield
Monthly
Performance ratio
Monthly
Inverter availability
Continuous
Fault alarms
Immediate
Export volume
Monthly
The Degradation Table
Factor
Effect
Module ageing
Gradual loss
Soiling
Reversible loss
Inverter efficiency
Stable then falling
Cable degradation
Slow loss
Connector faults
Sudden loss
Shading growth
Seasonal
The Maintenance Table
Task
Interval
Visual inspection
Quarterly
Cleaning
Site dependent
Thermal imaging
Annual
Torque check
Annual
Inverter service
Manufacturer schedule
Vegetation control
Seasonal
The Maintenance Cost Table
Item
Basis
Cleaning
Per square metre
Inspection
Per visit
Inverter replacement
Once in life
Insurance
Annual premium
Monitoring service
Subscription
Spare parts
As needed
The Response Table
Signal
Action
Yield below model
Investigate cause
String outage
Check connectors
Inverter alarm
Service call
Rising soiling
Clean array
Performance ratio fall
Full inspection
Export collapse
Check settings
Compare actual specific yield against the simulation month by month from the first year, because a slow decline is invisible in the annual total and obvious in a monthly trend.
Risk Register for a Factory Solar Project
The risks that damage a solar business case are administrative and operational more than technical, and most of them are foreseeable at the design stage.
The Project Risk Table
Risk
Consequence
Roof failure
Removal and reinstall
Connection delay
Lost generation
Yield shortfall
Payback extends
Tariff change
Saving reduces
Export limit imposed
Revenue loss
Inverter failure
Output gap
The Likelihood Table
Risk
Likelihood
Soiling above plan
Common
Inverter fault
Occasional
Grid constraint
Increasing
Tariff restructure
Occasional
Roof repair need
Common
Theft or damage
Site dependent
The Mitigation Table
Risk
Mitigation
Roof
Condition survey first
Connection
Early application
Yield
Independent simulation
Tariff
Sensitivity analysis
Export limit
Zero-export design option
Inverter
Warranty and spares
The Contract Table
Clause
Protects against
Performance guarantee
Yield shortfall
Availability guarantee
Downtime
Defect liability
Component failure
Completion date
Delay
Monitoring obligation
Silent failure
Handover documents
Operational gap
The Review Table
Trigger
Review
Annual results
Model versus actual
Tariff change
Recalculate saving
Expansion plan
Resize opportunity
Major repair
Array removal plan
Inverter replacement
Technology review
Buyer requirement
Evidence update
Put a performance guarantee into the supply contract, because a payback model that depends on an unguaranteed yield is a forecast with no counterparty.
Common Mistakes in Factory Solar Business Cases
Most failed solar projects were approved on a business case that ignored one input, and the same omissions recur across factories regardless of size.
The Mistake Table
Mistake
Consequence
Using annual totals only
Overstated self-use
Ignoring load profile
Export-heavy design
Assuming full export
Optimistic income
Skipping roof survey
Removal cost
Late grid application
Delay
No performance guarantee
Unmanaged yield risk
The Reality Check Table
Assumption
Reality check
Plant runs all day
Check shift pattern
Load is flat
Check interval data
Export is paid
Check contract
Tariff is stable
Check history
Cleaning unnecessary
Check soiling
No maintenance cost
Check contract
The Wrong Metric Table
Wrong comparison
Right comparison
Cost per kilowatt peak
Levelised cost
Payback only
Payback plus net present value
Gross saving
Net of maintenance
Year one saving
Twenty-year total
Purchase versus lease
Same metric both
Quote versus quote
Same assumptions
The Stage Gate Table
Stage
Question
Concept
Is the load there
Design
What self-use is credible
Finance
What is the downside case
Procurement
What is guaranteed
Installation
What is the roof condition
Operation
Who watches output
The Corrective Table
Realisation
Action
Self-use lower than modelled
Shift load or add storage
Export rate below assumption
Reduce array ambition
Roof condition poor
Defer and repair
Grid constrained
Design to zero export
Yield below model
Enforce guarantee
Cost overrun
Recalculate before stage two
Present a downside case alongside the base case, because a project that only works at the optimistic self-consumption rate is a project that depends on a assumption the factory has not tested.
What Buyers Ask About Factory Renewables
Bag buyers increasingly include energy questions in supplier questionnaires, and the answers that survive scrutiny are the ones backed by meter data rather than intent.
The Question Table
Question
What it tests
Do you have solar
Physical asset
How much does it cover
Share of consumption
Is it verified
Data quality
What about the rest
Purchased power
Are you expanding
Direction
How do you report
Method
The Answer Table
Question
Defensible answer
Capacity
Installed kilowatts, dated
Generation
Annual units, metered
Share
Percentage of consumption
Method
Location or market based
Certificates
Serial numbers, retired
Verification
Audit or utility data
The Claim Support Table
Claim
Support
Installed capacity
Commissioning report
Annual generation
Meter log
Consumption
Utility bills
Renewable share
Calculation sheet
Certificate ownership
Registry extract
Reduction
Baseline documented
The Boundary Table
Scope
What it covers
Site electricity
Factory meter
Owned generation
On-site array
Purchased green power
Contract
Certificates
Attribute only
Supply chain
Not included
Transport
Separate scope
The Communication Table
Audience
Emphasis
Buyer sustainability
Method and data
Buyer sourcing
Cost stability
Retailer programme
Certificates
Internal finance
Payback achieved
Workforce
Site investment
Regulator
Compliance evidence
Answer with the method as well as the number, because a renewable percentage without a stated basis invites the buyer to assume the most generous basis and then test it.
Sequencing the Project Across a Production Calendar
A solar installation disrupts the roof, the power distribution and sometimes the production floor, and the sequencing against the factory’s own calendar decides whether the disruption is absorbed or becomes a delivery problem.
The Calendar Table
Period
Factory condition
Peak season
Avoid disruption
Low season
Best window
Holiday shutdown
Ideal
Inventory build
Risky
New style launch
Avoid
Audit period
Avoid
The Disruption Table
Work package
Effect
Roof access
Restricted areas
Cable routes
Floor or ceiling access
Inverter installation
Wall space
Switchgear change
Short shutdown
Commissioning
Load interruption
Inspection
Access for authority
The Buffer Table
Risk
Buffer
Weather delay
Weeks
Connection approval
Months
Equipment lead time
Weeks
Rework after inspection
Weeks
Production conflict
Negotiated window
Commissioning faults
Days
The Coordination Table
Party
Contribution
Production planning
Window agreement
Maintenance
Access and isolation
Electrical contractor
Shutdown plan
Installer
Method statement
Landlord
Roof consent
Insurer
Notification
The Handover Table
Deliverable
Purpose
As-built drawings
Future work
Protection settings
Safe operation
Monitoring access
Performance tracking
Warranty documents
Claims
Training record
Competence
Spares list
Uptime
Agree the shutdown window with production planning before the installer mobilises, because a commissioning date that collides with a peak season shipping week costs more than the array saves in that month.
The Factory Solar Checklist
Before Design
Item
Done
Twelve months of bills collected
☐
Interval data obtained
☐
Shift pattern confirmed
☐
Roof condition surveyed
☐
Structural review commissioned
☐
Grid enquiry submitted
☐
During Design
Item
Done
Load profile modelled
☐
Self-consumption estimated
☐
Tariff structure mapped
☐
Export rules confirmed
☐
Shading assessed
☐
Layout optimised
☐
During Procurement
Item
Done
Independent yield simulation
☐
Performance guarantee agreed
☐
Availability guarantee agreed
☐
Monitoring scope defined
☐
Spares plan agreed
☐
Handover documents listed
☐
After Commissioning
Item
Done
Generation baseline set
☐
Monthly review scheduled
☐
Cleaning plan active
☐
Fault response defined
☐
Certificate records filed
☐
Annual model review booked
☐
FAQ
What payback period is realistic for a bag factory installing rooftop solar?
The range is wide and depends far more on self-consumption and tariff than on the cost of the panels. A single-shift plant in a moderate-irradiance location with a good roof and a daytime load that matches generation can reach payback in the mid single digits in years. A plant that runs mostly at night, or sells most output at a low export rate, will sit well beyond that. The number to insist on is a payback built from measured interval data rather than annual totals, and a downside case at a lower self-consumption rate. Without those two elements, any figure quoted is indicative at best.
How much of the factory’s electricity can rooftop solar actually cover?
It can cover most of the daytime consumption if the array is sized to the load curve and the roof is large enough, but the share of total consumption is usually lower because of night shifts and weekend base load. For a single day shift, a solar fraction of thirty to fifty percent of annual consumption is a realistic outcome with a well-matched array. For a three-shift operation the fraction falls, even though self-consumption of what is generated stays high. The distinction matters: solar fraction answers the buyer’s question, self-consumption answers the finance question.
Is battery storage necessary to make the project viable?
No, and adding storage to a project that already has good self-consumption usually lengthens payback rather than shortening it. Storage earns its place in specific conditions: a heavy evening load that could absorb stored energy, a demand charge large enough to justify peak clipping, a tariff with a wide spread between cheap and expensive hours, or an unreliable grid where continuity has value. Where none of those apply, capital spent on batteries generally returns less than the same capital spent on more panels, provided the roof and grid connection allow them.
What happens if the grid connection is limited?
It becomes a design constraint rather than a project stopper. The usual responses are to size the array to the permitted export capacity, to design for zero export with a control system that throttles the inverter, or to add storage so that surplus generation is shifted rather than exported. Each has a cost: a smaller array reduces savings, zero export curtails output at peak times, and storage adds capital. The important discipline is to apply for the connection before committing to module orders, because the approval timeline is often longer than the installation timeline.
Do renewable certificates matter to bag buyers?
They matter when a buyer needs a documented attribute rather than a physical electron, which is increasingly the case in supplier questionnaires and retailer programmes. On-site generation is the strongest evidence because it combines a physical asset with metered output, but certificates allow a factory to claim a renewable share beyond what its roof can produce. The risk is in conflating the two: a certificate-backed claim and a self-generated claim have different evidence trails, and a buyer who asks for serial numbers will expose a claim that was assembled from estimates rather than retired certificates.
How much maintenance does a factory array need?
Less than most plant equipment, but not none. Visual inspection and connector checks at a quarterly interval, cleaning at a frequency set by local soiling, thermal imaging annually to find failing connections, and inverter servicing to the manufacturer’s schedule are the normal minimum. The cost is modest relative to the capital, and the value is in catching string outages and soiling build-up early, because both reduce output quietly. A factory that never inspects the array typically loses a few percent of yield per year without noticing, which extends payback by months.
Should the factory buy the array or sign a power purchase agreement?
It depends on capital availability, tenure and the internal hurdle rate. Buying captures the full saving and gives the factory control, but puts performance and roof risk on its own balance sheet. A power purchase agreement removes the capital requirement and transfers much of the technical risk, at the cost of paying a margin for twenty years. For an owner-occupied building with available capital and a long horizon, purchase usually wins on total value. For a rented building or a capital-constrained year, an agreement can still deliver a lower electricity price with no investment, and the faster payback that results should be described as a different metric, not as a better project.
How should the factory report its renewable share to buyers?
With the method stated alongside the number. The two recognised approaches are location based, which uses the grid average for the area, and market based, which uses contracts and certificates the factory has actually retired. Reporting both is the most defensible option, and it prevents a buyer from assuming the more generous method was used. The supporting evidence should be the utility bills for consumption, the generation meter log for on-site output, and the certificate register for any purchased attribute. A percentage quoted without that basis is likely to be challenged at the next audit.
Conclusion
A solar payback figure for a bag factory is a statement about a specific building, a specific load and a specific contract. It is not a property of the technology, and it should not be compared across sites without those three elements attached.
The inputs that decide the outcome are few. Self-consumption comes first, because a unit used on site is worth the retail tariff while an exported unit is worth whatever the grid offers. Tariff structure comes second, particularly whether the plant’s peak demand coincides with generation. Installed cost and yield matter, but they vary less between projects than the first two.
The constraints that decide whether the project happens at all are physical and administrative. Roof condition determines whether mounting is sensible now or after a re-roof. Grid capacity determines the maximum size and sometimes the design philosophy. Tenure determines whether purchase or a power agreement is the right structure.
The operating discipline determines whether the modelled payback is achieved. Monthly comparison of specific yield against the simulation, a cleaning and inspection routine, and a contract with a performance guarantee turn a forecast into a managed asset.
For a factory, the credible position is a base case built on measured interval data, a downside case at lower self-consumption, a stated method for any renewable claim, and a monitoring routine that reports deviation early. That is a business case that survives an audit, and it is more useful than a single number quoted to one decimal place.