
In-Line Quality Control Systems for Backpack Factories
A backpack factory can inspect every finished pack and still ship bad quality. That is the uncomfortable truth of final-only inspection: by the time the pack is finished, the defects are already sewn in. A crooked zipper, a skipped stitch, a misaligned panel — each one was created at a specific workstation, minutes or hours earlier, and the final inspector can only catch it, not prevent it.
In-line quality control flips the logic. Instead of catching defects at the end, the factory catches them where they are created — at the first piece, at each operation, at every process checkpoint. This guide explains how professional backpack factories run in-line QC: the architecture, the checkpoints, the first-piece system, patrol inspection, defect recording, root-cause analysis, corrective action, rework management, and how in-line data drives continuous improvement.
- Why In-Line Beats Final-Only
- The Architecture of an In-Line QC System
- The First-Piece System
- Patrol Inspection: The Walking Check
- The Critical Checkpoints in Detail
- Defect Recording and Pareto Analysis
- Corrective Action: From Defect to Root Cause
- Rework Management
- Measuring the System: The Quality Metrics
- In-Line QC and the Buyer: Working Together
- Building an In-Line QC System: A Step-by-Step Guide
- Why In-Line QC Systems Fail
- Case Study: One Line, One Month
- Third-Party Mid-Line Inspection
- The Cost of Quality: What In-Line QC Really Pays
- The Buyer’s In-Line QC Verification Checklist
- From Inspection to Culture: Continuous Improvement
- The Long Game: Quality as the Business Model
- FAQ
- Conclusion
Why In-Line Beats Final-Only
The economics of quality control are brutal and simple: the later a defect is found, the more it costs.
| Discovery point | Cost multiplier | Example (a crooked zipper) |
|---|---|---|
| At the sewing station | 1× | Operator unstitches, resews — 2 minutes |
| At assembly | 3× | Panel must be separated, replaced |
| At final inspection | 5× | Full rework through the line |
| After packing | 10× | Unpack, rework, repack |
| At arrival inspection | 25× | Claims, freight, returns |
| With the customer | 100× | Refunds, brand damage, lost reorders |
Manufacturer’s note: Final inspection tells you what went wrong all day. In-line inspection tells you what is going wrong right now. The factory that relies on final inspection alone is paying the quality bill at the most expensive point in the process — and shipping the mistakes that slipped through.
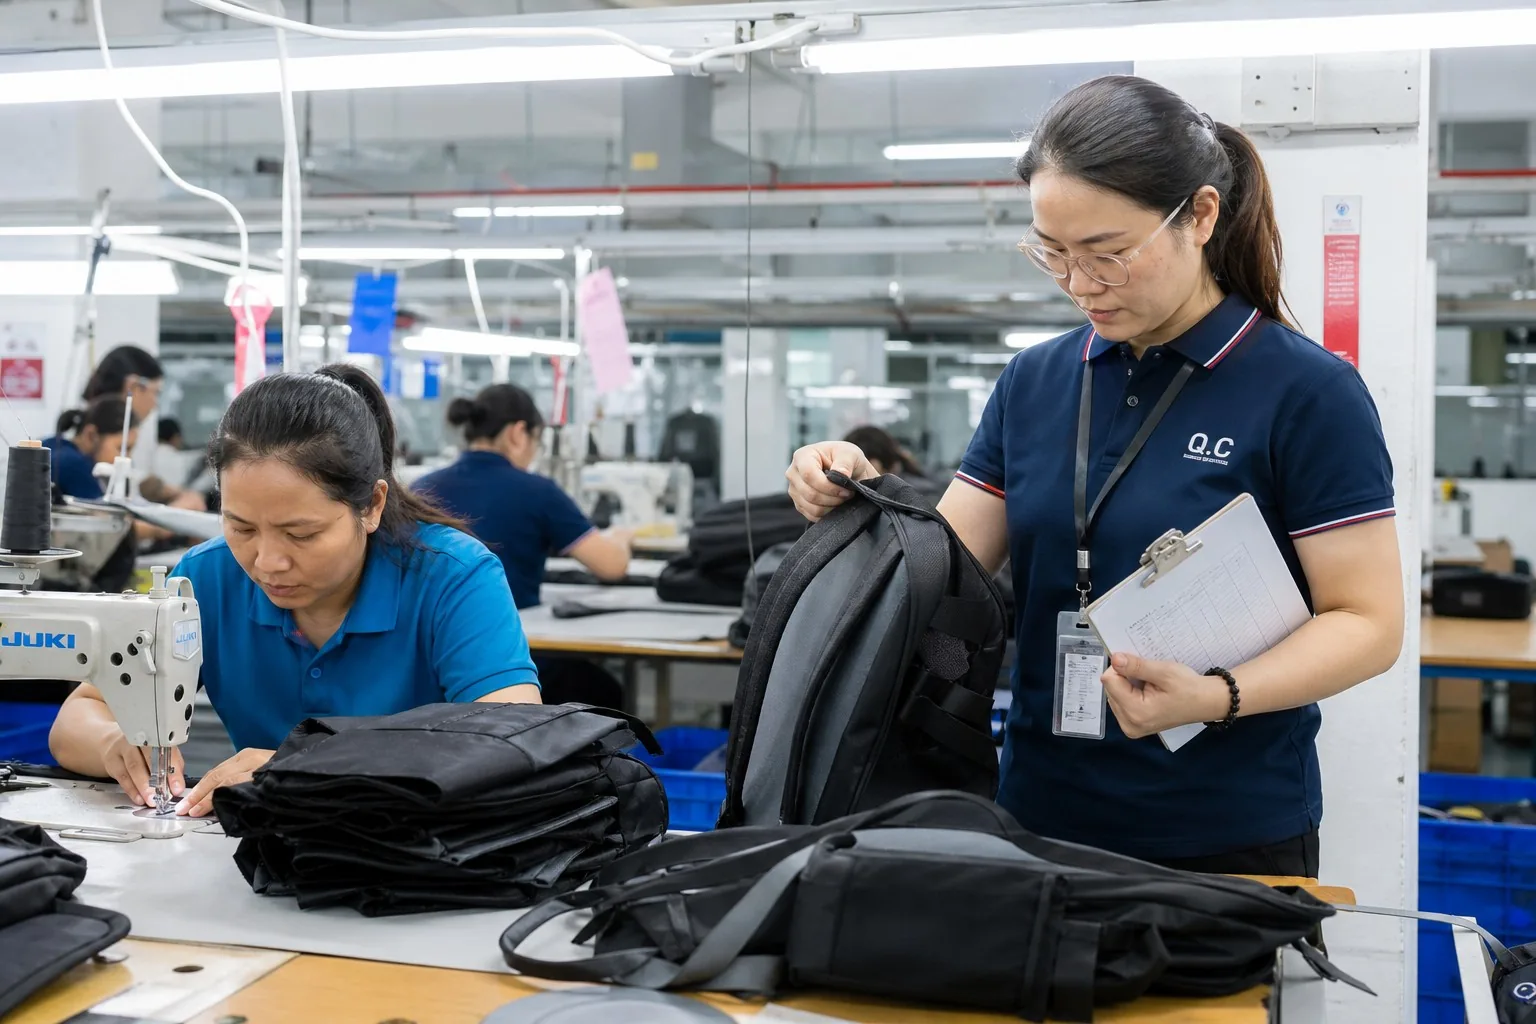
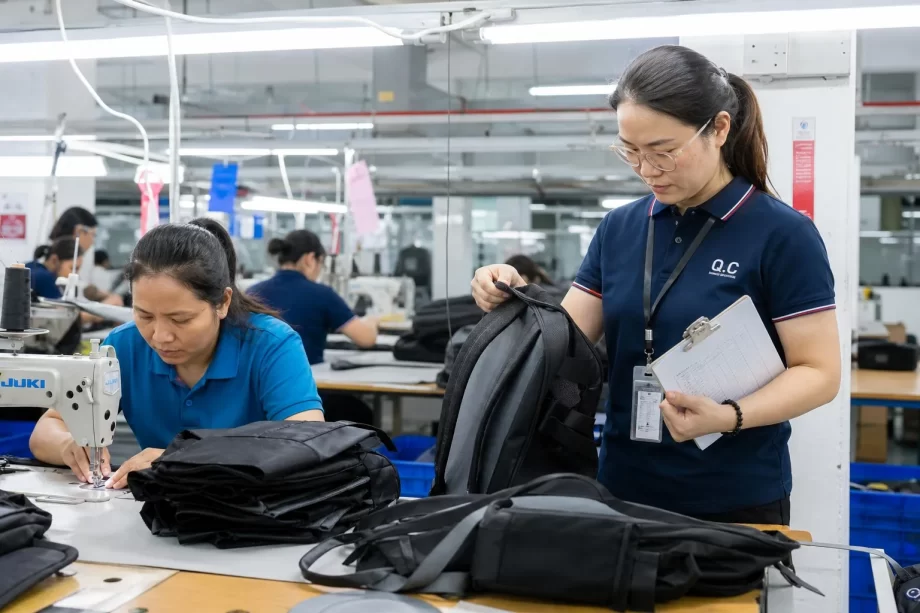
The Architecture of an In-Line QC System
A professional in-line QC system has four layers:
Layer 1: The QC Team Structure
| Role | Responsibility |
|---|---|
| QC manager | System design, standards, audits |
| Line QC | Assigned per production line |
| First-piece inspectors | Check the first unit of each operation |
| Patrol inspectors | Walk the line, sample checks |
| Final inspectors | Finished-goods inspection |
| Rework team | Fix defects to standard |
Layer 2: The Checkpoint Map
Every product gets a checkpoint map — the list of points where quality is verified:
| Checkpoint | What is checked | Frequency |
|---|---|---|
| Incoming materials | Fabric, hardware, spec match | Every lot |
| Cutting | Dimensions, defects, grain direction | First piece + patrol |
| Preparation | Fusing, marking, edge prep | First piece |
| Sewing stations | Stitch quality, alignment, tension | First piece + patrol |
| Sub-assembly | Pockets, sleeves, straps | First piece |
| Final assembly | Panel joining, zipper function | First piece |
| Post-finishing | Thread trimming, pressing, cleaning | Full check |
| Packing | Labels, polybags, cartons | First carton + random |
Layer 3: The Standards
- Approved sample (sealed, signed)
- Written work instructions per operation
- Visual standards (photos of acceptable vs defective)
- Measurement standards (dimensions, tolerances)
- AQL levels for sampling decisions
Layer 4: The Records
- First-piece check sheets
- Patrol inspection logs
- Defect tally sheets
- Rework records
- Daily quality summary
Manufacturer’s note: The architecture is worthless without the discipline. The best QC system in the industry fails when the first-piece check is skipped “just this once” or the patrol log is filled in at the end of the day. Factories that build QC habits — not just QC stations — are the ones whose quality holds at volume.
The First-Piece System
The first piece of every operation is the most important unit of the day. If the first piece is right, the operation is set up correctly. If it is wrong, everything that follows will be wrong too.
The First-Piece Rules
| Rule | Why |
|---|---|
| Check before production starts | Setup errors are caught instantly |
| Check against the approved sample | The sample is the law |
| Document the result | Records enable accountability |
| Stop the line on failure | Never run a bad setup |
| Recheck after every change | Thread, tension, or operator changes reset the setup |
The First-Piece Checklist (Sewing Station)
- [ ] Stitch density matches spec (SPI)
- [ ] Tension balanced — no loops or puckering
- [ ] Seam allowance correct
- [ ] Alignment matches the pattern
- [ ] Thread color matches approved sample
- [ ] No skipped stitches
- [ ] Needle size and type correct for the fabric
The First-Piece Reality Check
Two questions reveal whether the first-piece system is real or decorative:
- Ask the operator: “What did you check on your last first piece?” A trained operator answers with specifics — stitch count, seam allowance, alignment. A decorative system gets a blank look.
- Ask for yesterday’s first-piece sheets: real sheets have times, signatures, and occasional failures noted. Perfect sheets with no failures ever recorded are usually fiction — every line finds something on some days.
The first-piece system is the factory’s first line of defense. When it is real, setup errors die at the source. When it is decorative, they flow through the entire line — and surface at final inspection, where they cost five times more to fix.
The First-Piece Discipline
- Every operation leader signs the first-piece sheet.
- The line QC audits first-piece records daily.
- First-piece failures trigger an immediate stop and root-cause discussion.
- First-piece results feed the daily quality meeting.
Patrol Inspection: The Walking Check
Between first pieces, the line runs. Patrol inspection keeps it honest:
The Patrol Method
| Element | Practice |
|---|---|
| Route | Fixed route through all stations |
| Frequency | Every 30–60 minutes per station |
| Sample | 2–3 units per station per pass |
| Focus | High-risk operations first |
| Record | Result logged immediately |
| Feedback | Operator informed on the spot |
What Patrol Catches
- Tension drift as machines warm up
- Thread breaks and skipped stitches
- Alignment drifting after hundreds of units
- Operator fatigue effects (slower, sloppier)
- Material changes within the roll
- Tool wear (dull needles, worn feet)
The Defect Severity Classification
Not all defects are equal. In-line QC classifies them to prioritize action:
| Severity | Definition | Examples | Action |
|---|---|---|---|
| Critical | Safety, function failure | Broken buckle, seam tear-out | Stop the line immediately |
| Major | Function or appearance affected | Crooked zipper, misaligned panel | Fix before further production |
| Minor | Cosmetic only | Loose thread, slight puckering | Trim at finishing |
| Observation | Acceptable, note only | Minor shade variation | Monitor the trend |
The severity system prevents two classic failures: treating cosmetic issues as emergencies (slowing production needlessly) and treating function failures as cosmetic (shipping defects). Classification makes the response proportional — and the records make the classification consistent across inspectors and shifts.
The Patrol Escalation
| Finding | Action |
|---|---|
| Single random defect | Note, repair, continue |
| Pattern of defects | Stop the station, find the cause |
| Station repeated failures | Remove operator for retraining or reassignment |
| Widespread issue | Stop the line, escalate to production manager |
The Critical Checkpoints in Detail
Each production stage has its own defect universe. Here is what in-line QC watches at each:
Cutting Checkpoint
| Check | Acceptable | Defect to catch |
|---|---|---|
| Dimensions | Within tolerance | Wrong-size panels |
| Grain direction | Matches spec | Fabric wasted |
| Defect placement | Defects excluded from parts | Defective panels sewn in |
| Notch and mark alignment | Matches pattern | Misassembled parts |
| Layer count | Full stack cut | Short stacks |
Sewing Checkpoints
| Check | Acceptable | Defect to catch |
|---|---|---|
| Stitch density | Spec SPI | Weak seams |
| Stitch tension | Balanced | Puckering, loops |
| Seam alignment | Pattern match | Crooked seams |
| Zipper installation | Smooth, straight | Crooked zippers |
| Bar-tack placement | At stress points | Tear-out risk |
| Thread tension on curves | No pleats | Distorted panels |
Assembly Checkpoints
| Check | Acceptable | Defect to catch |
|---|---|---|
| Panel alignment | Symmetric | Misaligned panels |
| Pocket placement | Spec position | Off-position pockets |
| Strap attachment | Centered, reinforced | Weak or crooked straps |
| Hardware function | Smooth operation | Stiff or broken hardware |
| Padding placement | Fills the panel | Shifted padding |
Finishing Checkpoints
| Check | Acceptable | Defect to catch |
|---|---|---|
| Thread trimming | Clean | Loose threads |
| Pressing | Sharp edges | Wrinkles, shine |
| Cleaning | Spot-free | Oil marks, stains |
| Logo placement | Spec position | Crooked logos |
| Packaging | Correct labels | Wrong packs in wrong cartons |
Defect Recording and Pareto Analysis
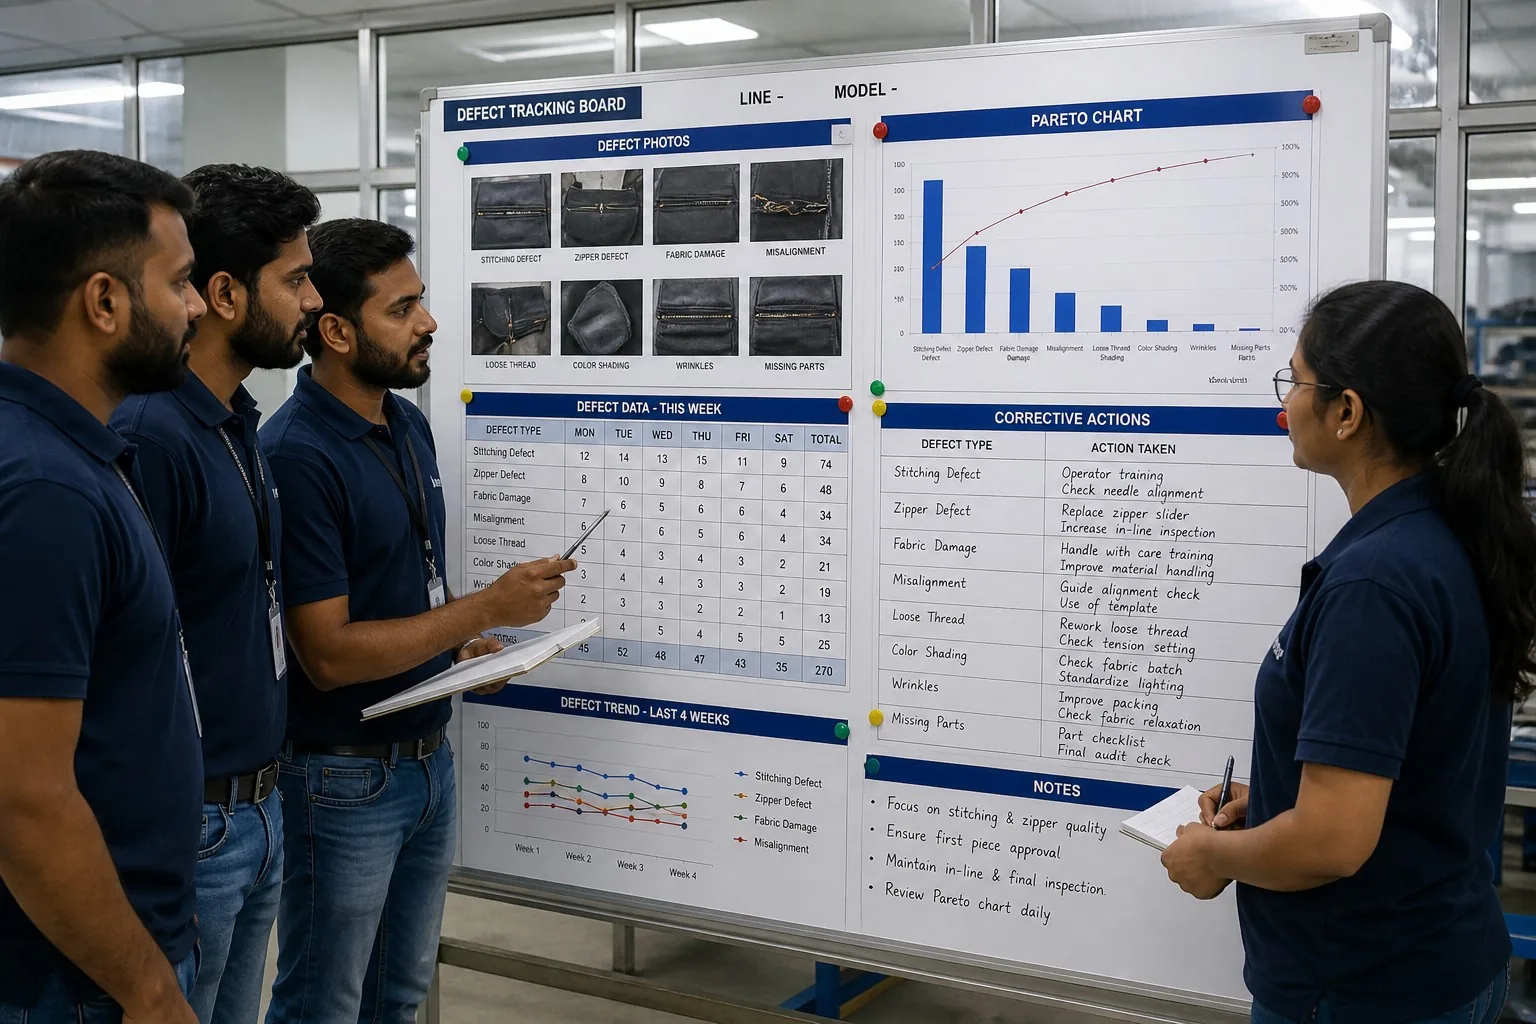
Data turns inspection from activity into intelligence. Every defect is recorded — and the records drive improvement:
The Defect Recording System
| Field | Purpose |
|---|---|
| Date and time | Trend analysis |
| Line and station | Location of the problem |
| Operator | Accountability and training needs |
| Defect type | Pareto ranking |
| Defect severity | Priority setting |
| Quantity affected | Scale of the problem |
| Immediate action | What was done |
The Pareto Reality
Most factories find that 20% of defect types cause 80% of defects:
| Rank | Typical top defects in backpack lines |
|---|---|
| 1 | Skipped stitches and loose seams |
| 2 | Crooked zipper installation |
| 3 | Misaligned panels and pockets |
| 4 | Loose threads and poor finishing |
| 5 | Hardware stiffness and breakage |
The Quality Data Flow
Quality data flows in a daily rhythm that connects the floor to management:
- Hourly: Patrol findings recorded at each station.
- Shift end: Line QC tallies defects, counts first-piece checks.
- Morning: Daily quality meeting reviews yesterday’s numbers.
- Weekly: Pareto analysis ranks defect types; corrective actions assigned.
- Monthly: Trends reviewed; improvement projects launched or closed.
The flow makes quality visible at every level — the operator sees the station log, the supervisor sees the line tally, the manager sees the weekly Pareto, and the buyer sees the monthly summary. When the data flows, quality cannot hide; when quality cannot hide, it improves.
The Weekly Pareto Review
- Tally the week’s defects by type.
- Rank them — the top few dominate.
- Assign the top three to improvement projects.
- Review the trend — is this week better than last?
- Celebrate the wins — improvement is visible.
Manufacturer’s note: The factory that can show you its Pareto chart — the top defects, the trend lines, the corrective actions — is running a real quality system. The factory that shows you a clean floor and vague promises is showing you the showroom. Data is the difference between quality theater and quality management.
Corrective Action: From Defect to Root Cause
Recording defects without fixing causes is like mopping a floor with the tap running. Corrective action closes the loop:
The Corrective Action Ladder
| Level | Action | When |
|---|---|---|
| 1. Containment | Stop the bleeding — sort, repair, quarantine | Immediately |
| 2. Correction | Fix the affected units | Same day |
| 3. Root cause | Find why it happened | Within days |
| 4. Corrective action | Change the process, tool, or training | Within the week |
| 5. Prevention | Verify the fix holds across runs | Ongoing |
The Root-Cause Toolkit
| Tool | What it finds |
|---|---|
| 5 Whys | The causal chain |
| Fishbone (Ishikawa) | Material, machine, method, man, measurement |
| Process mapping | Where the defect entered |
| Data review | When it started, how often |
| Operator interview | What changed at the station |
The 8D Approach in Brief
| D | What |
|---|---|
| D1 | Team assembled |
| D2 | Problem described |
| D3 | Interim containment |
| D4 | Root cause identified |
| D5 | Corrective action chosen |
| D6 | Action implemented |
| D7 | Prevention verified |
| D8 | Closure and lesson learned |
The Correction Trap
The most common failure is stopping at correction: fix the pack, keep sewing, never ask why. The factory that stops at correction repeats the same defect next week — and ships it next month. Root-cause discipline is what separates factories that improve from factories that repeat.
Rework Management
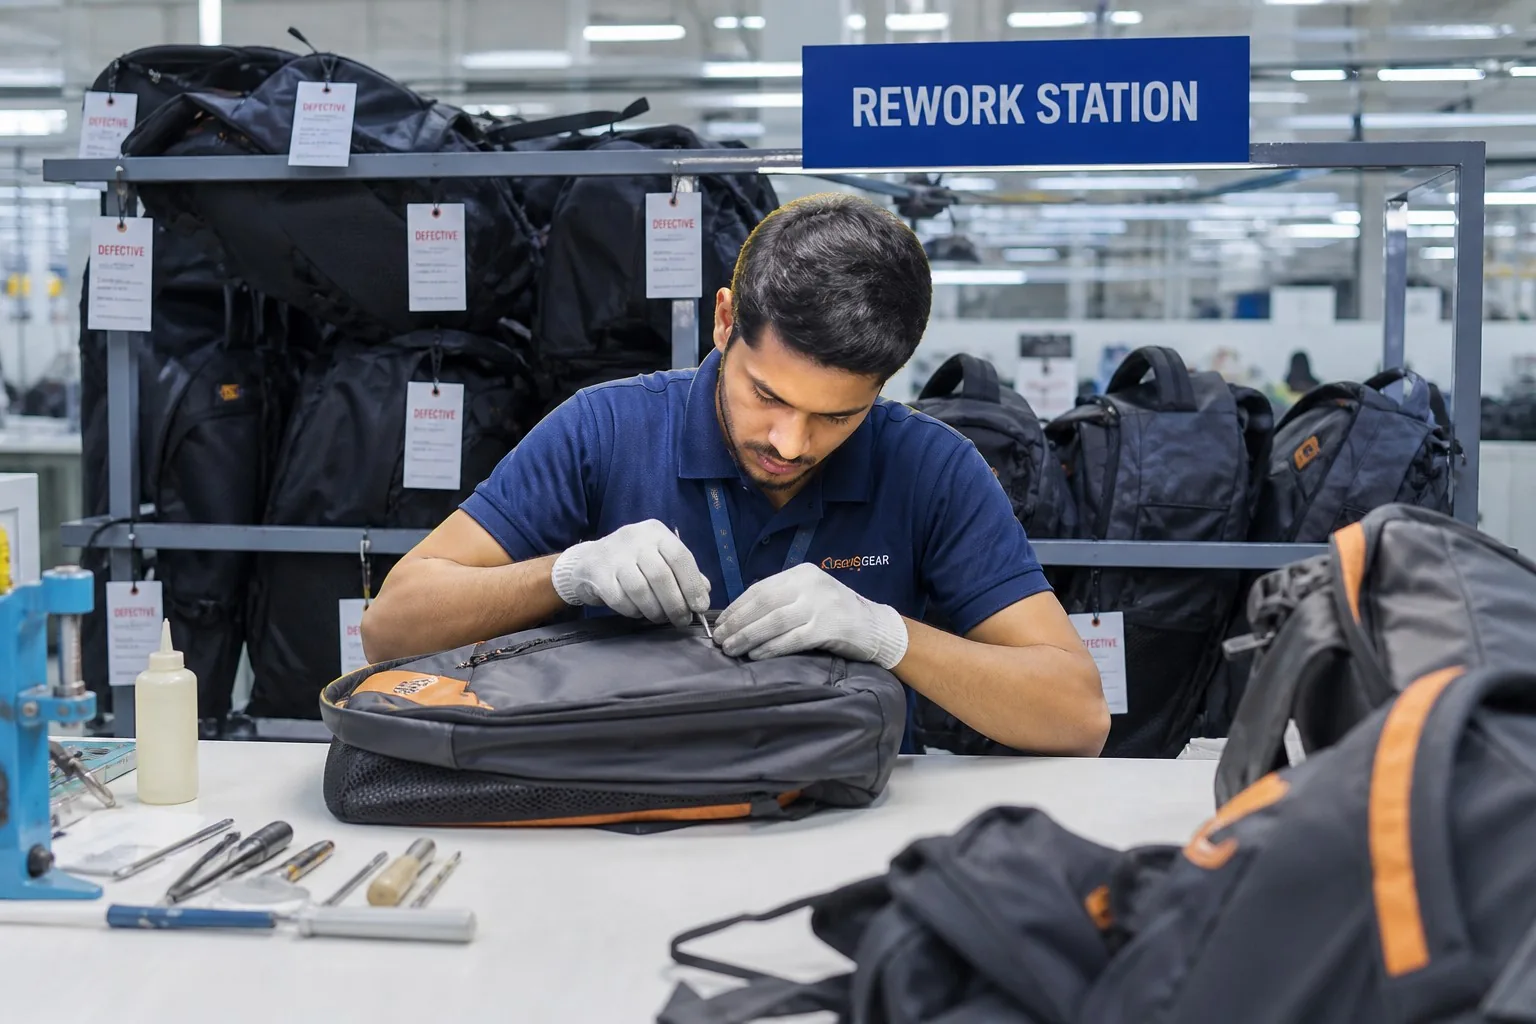
Rework is the safety net — but it must be controlled:
The Rework Rules
| Rule | Why |
|---|---|
| Rework to the original standard | Never “good enough” |
| Separate rework from the line | Prevents mixing |
| Track rework by cause | Drives root-cause analysis |
| Cap rework time | High rework = stop the source |
| Inspect after rework | Repaired units are checked again |
The Rework Warning Signals
| Signal | Meaning |
|---|---|
| Rework rate above 5% | The line or process is failing |
| Same defect reworked repeatedly | Root cause not addressed |
| Rework done without records | Quality is undocumented |
| Repaired units bypass inspection | Defects ship to the customer |
| Rework absorbing operators | Capacity is being wasted |
Measuring the System: The Quality Metrics
In-line QC produces the numbers that run the factory:
The Core Metrics
| Metric | Formula | Healthy level |
|---|---|---|
| First-pass yield (FPY) | Units passing first time ÷ total | 90%+ |
| Defect rate | Defects found ÷ units checked | <5% |
| Rework rate | Units needing rework ÷ total | <5% |
| PPM | Defects per million units | <50,000 |
| On-time inspection | Inspections done on schedule | 100% |
| Corrective action closure | Actions closed ÷ opened | 90%+ within 30 days |
The Daily Quality Scoreboard
| Board item | Source |
|---|---|
| Yesterday’s FPY | Line QC records |
| Top 3 defects | Pareto tally |
| Rework rate | Rework log |
| Open corrective actions | Action register |
| Today’s priorities | Management call |
The Quality Meeting Rhythm
- Daily (15 min): yesterday’s numbers, today’s risks, immediate actions.
- Weekly (30 min): Pareto review, corrective actions, improvement projects.
- Monthly (60 min): trend analysis, supplier issues, customer feedback, goals.
In-Line QC and the Buyer: Working Together
Buyers have a stake in the system — and tools to verify it:
The Buyer’s In-Line Tools
| Tool | What it verifies |
|---|---|
| Mid-production inspection | Line quality in real time |
| First-piece review | The standard is understood |
| QC record audit | The system is real |
| Defect log review | Problems are being tracked |
| Corrective action review | Problems are being fixed |
| Weekly production report | Progress and quality visibility |
The Mid-Production Inspection
The most valuable buyer inspection happens mid-run, not at the end:
- Schedule it at 30–50% production.
- Check the units in progress, not the finished display.
- Review the QC records for the run so far.
- Confirm corrective actions from earlier findings.
- Adjust before the whole batch is sewn wrong.
The Buyer Questions That Reveal the System
- “Show me your first-piece records from today.”
- “What were the top three defects this week?”
- “What corrective actions are open, and when do they close?”
- “What is the FPY trend over the last four weeks?”
- “How do you handle a station that fails repeatedly?”
Building an In-Line QC System: A Step-by-Step Guide
For factory managers building the system — and buyers evaluating it — here is the construction sequence:
The Build Plan
| Step | Action | Output |
|---|---|---|
| 1 | Define the quality standard | Approved sample, written spec, visual aids |
| 2 | Map the process | Every operation and its inputs/outputs |
| 3 | Choose the checkpoints | Where defects are created |
| 4 | Staff the QC team | Line QC, first-piece, patrol roles |
| 5 | Create the forms | First-piece sheets, patrol logs, defect tallies |
| 6 | Train the team | Standards, forms, escalation rules |
| 7 | Run a pilot line | One line for 2 weeks, refine |
| 8 | Roll out | All lines, with daily review |
| 9 | Measure and improve | FPY, Pareto, corrective actions |
| 10 | Audit the system | Monthly internal audits |
The Starter Kit (Documents)
| Document | Purpose |
|---|---|
| Approved sample register | The law, sealed and signed |
| First-piece check sheet | Per operation |
| Patrol inspection log | Per line per shift |
| Defect tally sheet | Daily per line |
| Rework log | Repairs tracked by cause |
| Corrective action register | Root cause and closure |
| Daily quality summary | Management visibility |
| Visual standards board | Good vs bad examples |
The Timeline
A functioning system takes about 4–8 weeks to build on one line:
| Week | Milestone |
|---|---|
| 1–2 | Standards, checkpoints, forms, training |
| 3–4 | Pilot line running, forms refined |
| 5–6 | Rollout to remaining lines |
| 7–8 | First monthly review, first improvement cycle |
Manufacturer’s note: Start small and make it real. A pilot line with honest records beats a factory-wide system with decorative forms. Buyers should ask which lines run the full system — the answer separates the pilot from the theater.
Why In-Line QC Systems Fail
Systems fail for predictable reasons. Recognizing them protects both factories and buyers:
| Failure mode | Symptom | Root cause | The fix |
|---|---|---|---|
| Paper compliance | Forms filled, nothing changes | QC seen as paperwork | Management reviews data weekly |
| Inspection theater | Clean showroom, real floor ignored | Buyer visits only the tour route | Unannounced visits, real records |
| Speed over quality | QC overridden to hit schedule | Production incentives dominate | Quality has stop-the-line power |
| No root cause | Same defect every week | Correction only, no analysis | 5 Whys discipline |
| Record inflation | Perfect logs, real defects | Fear of consequences | Blame-free defect reporting |
| Untrained inspectors | Checks miss the defects | Hiring without training | Certification program |
| Incentive misalignment | Operators rushed | Piece-rate without quality gate | Quality-linked incentives |
The Blame-Free Principle
The most important cultural element: defects must be reportable without fear.
- Operators who hide defects create silent failures.
- Inspectors who flag problems need support, not punishment.
- Management must treat defects as process signals, not personal failures.
- Improvement comes from honest data, which comes from psychological safety.
The Management Signals
Operators and inspectors watch what management rewards:
| Management action | Signal sent |
|---|---|
| Stops the line for quality | Quality is real |
| Reviews QC data daily | Data matters |
| Rewards defect reporting | Honesty is valued |
| Fixes root causes quickly | Problems get solved |
| Punishes inspection findings | Hide the problems |
| Prioritizes output always | Quality is optional |
Case Study: One Line, One Month
A typical transformation, compressed:
| Week | Situation | Action | Result |
|---|---|---|---|
| Start | FPY 78%, rework 12% | Audit the line | Top defects identified |
| 1 | Crooked zippers #1 | First-piece + tension check | Zipper defects halved |
| 2 | Skipped stitches #2 | Needle program, thread audit | Stitch defects down 40% |
| 3 | Misaligned panels #3 | Pattern check, operator training | Alignment defects down |
| 4 | Full system running | Weekly Pareto review | FPY 91%, rework 6% |
The lesson: most defects are process problems, not people problems. Fix the process — needle, tension, pattern, training — and the quality follows. The line QC system is the instrument that reveals which process to fix.
Third-Party Mid-Line Inspection
Independent inspection adds objectivity. Most international buyers use third-party inspectors alongside the factory’s own system:
The Inspection Companies
| Company | Typical services | Best for |
|---|---|---|
| SGS | Full QC, testing, audits | Large programs, compliance |
| Bureau Veritas | QC, social audits | Multi-market brands |
| Intertek | QC, product testing | Detailed technical specs |
| TUV | Testing, certification | Market-entry compliance |
| Local agencies | QC at lower cost | Cost-sensitive buyers |
The Mid-Line Inspection Scope
| Element | What the inspector checks |
|---|---|
| Production stage | Confirms the run is 30–50% complete |
| Work-in-progress | Samples from the line, not the display |
| First-piece records | The standard is being followed |
| Defect logs | Problems are being tracked |
| Corrective actions | Fixes are real and timely |
| Material verification | Fabric, hardware match the spec |
The Inspection Report
A professional report includes:
- Photos of samples and defects
- Defect classification (critical, major, minor)
- Quantity affected estimates
- AQL-based findings
- Recommendations and timeline
The Buyer’s Choice
| Situation | Recommendation |
|---|---|
| New factory, first order | Third-party mid-line + final |
| Established factory, good record | Factory reports + periodic audits |
| High-value order | Third-party every production stage |
| Compliance-critical market | Third-party + certified testing |
Manufacturer’s note: Third-party inspection is not an insult to a good factory — it is evidence for the buyer and protection for both sides. Factories with real systems welcome independent verification; the report confirms what the records already show. The factories that resist inspection are the ones with something to hide.
The Cost of Quality: What In-Line QC Really Pays
Quality control costs money — and pays more. The cost of quality (COQ) model makes the arithmetic visible:
The COQ Model
| Cost category | What it includes | Share of sales (typical) |
|---|---|---|
| Prevention | QC staff, training, standards | 0.5–1% |
| Appraisal | Inspection, testing | 1–2% |
| Internal failure | Rework, scrap, downtime | 1–3% |
| External failure | Returns, claims, freight, brand loss | 2–8% |
| Total COQ | All of the above | 5–14% |
The In-Line Investment Logic
| Investment | Typical effect |
|---|---|
| +1 QC staff per 2 lines | FPY +5–10% in the first quarter |
| First-piece discipline | Setup defects eliminated |
| Patrol frequency doubled | Drift caught earlier |
| Root-cause program | Top defect types reduced 30–50% |
| Inspector training | Catch rate improves significantly |
The Math of One Avoided Disaster
A single batch caught mid-run instead of at arrival:
| Scenario | Cost |
|---|---|
| Mid-line catch: stop, fix, re-inspect | $2,000 |
| Arrival catch: reject, return, rework | $12,000 |
| Customer catch: refunds, freight, brand | $60,000+ |
The Buyers’ Return
Buyers pay for quality twice — once in the price, once in the problems. A factory with a real in-line system prices prevention into the unit cost; a factory without it prices failure into your future. The difference is usually 1–3% of unit price — the cheapest insurance in the industry.
The Buyer’s In-Line QC Verification Checklist
When visiting a factory, verify the system in minutes:
- [ ] First-piece sheets on the stations, dated and signed?
- [ ] Patrol logs with real times and findings?
- [ ] Defect tally sheets matching the week’s output?
- [ ] Rework station separate, organized, tracked?
- [ ] Corrective action register with dates and closures?
- [ ] FPY and defect trends posted and current?
- [ ] QC staff present on the floor, not just in the office?
- [ ] Operators can explain their first-piece check?
- [ ] Management reviews quality data daily?
- [ ] Blame-free reporting — defects surface without fear?
From Inspection to Culture: Continuous Improvement
The final stage of the journey is culture — when quality stops being the QC team’s job and becomes everyone’s habit:
The PDCA Rhythm
| Phase | Activity |
|---|---|
| Plan | Choose the improvement target from Pareto data |
| Do | Run the change on one line or station |
| Check | Measure the effect against the baseline |
| Act | Standardize what worked, repeat for the next target |
The Improvement Proposals
The best improvement ideas come from the operators who touch the packs all day:
| Idea source | Example |
|---|---|
| Operator | “This needle keeps breaking on the curved seam” |
| Inspector | “The tension drifts after lunch — machine warms up” |
| Supervisor | “This station always runs out of pre-cut parts” |
| Data | “Defect X spikes every Tuesday — new operator training day” |
The Quality Culture Signals
- Operators stop the line without fear.
- Inspectors are respected, not resented.
- Improvement ideas get implemented, not collected.
- Quality data is public, not secret.
- Recognition flows to quality heroes, not just output heroes.
Manufacturer’s note: The culture is visible in five minutes: watch what happens when someone finds a defect. In a mature culture, the finding starts a conversation about the cause. In an immature culture, it starts an argument about blame. The factories with the best quality have the calmest defect conversations — because the system handles the defect and the culture handles the learning.
The Long Game: Quality as the Business Model
Quality is not a cost center — it is the business model:
- A factory with a 95% FPY and 2% rework has more capacity than a factory with the same staff and 80% FPY. Quality IS capacity.
- A factory that ships clean containers earns reorders, referrals, and premium pricing. Quality IS marketing.
- A factory with real records negotiates from strength; the data proves the promise. Quality IS sales.
- A factory that prevents defects spends less on firefighting. Quality IS margin.
The in-line QC system is the instrument that produces all of it — capacity, reputation, sales, and margin. Buyers who partner with factories running real systems are not paying for inspection; they are investing in the entire chain.
FAQ
What is in-line quality control in backpack production?
In-line QC is inspection performed during production — first-piece checks, patrol inspection at stations, and checkpoints at cutting, sewing, assembly, and finishing — instead of relying on final inspection alone. It catches defects where they are created, when they are cheapest to fix.
What is a first-piece check and why does it matter?
The first piece of each operation is checked against the approved sample before full production starts. If the setup is wrong, the first piece reveals it instantly — preventing hundreds of defective units. First-piece checks are the foundation of defect prevention.
What are the most common backpack defects found in-line?
Skipped stitches and loose seams, crooked zipper installation, misaligned panels and pockets, loose threads and poor finishing, and hardware stiffness or breakage. Pareto analysis usually shows a handful of defect types causing most problems.
What is a healthy first-pass yield for a backpack line?
A first-pass yield of 90% or above is healthy for a standard backpack line. Below 85%, the process needs attention — line balance, operator training, or material issues. FPY below 80% signals a process problem that rework is masking.
How should a buyer inspect during production?
Schedule a mid-production inspection at 30–50% completion. Check units in progress, review the factory’s QC records and defect logs, verify corrective actions, and confirm the approved standard is being followed — before the full batch is sewn.
What is the difference between inspection and corrective action?
Inspection finds defects; corrective action prevents them. Inspection without corrective action repeats the same defects indefinitely. A real quality system records defects, finds root causes, changes the process, and verifies the fix — closing the loop from defect to prevention.
How do I know a factory’s QC system is real?
Ask for first-piece records, defect logs, Pareto analyses, corrective action registers, and FPY trends. Real systems have documents with dates and numbers. Showroom-quality factories have clean floors and vague promises — the data tells the truth.
Conclusion
In-line quality control is the difference between a factory that catches defects and a factory that creates them. The architecture is simple — trained inspectors, mapped checkpoints, first-piece discipline, patrol routes, defect records — but the power is in the discipline: every first piece checked, every defect recorded, every root cause pursued, every correction verified.
For buyers, the system is both a promise and a test. A factory that runs real in-line QC shows it in the data: FPY trends, Pareto charts, corrective action registers, mid-run inspections that pass. A factory that relies on final inspection alone shows it in the returns.
We run first-piece checks at every station, patrol every line, record every defect, and close every corrective action with a root cause. Ask us for our quality board — the data is the answer.