

Backpack Production Costs: What Drives Factory Pricing
Every backpack price is a story. When a factory quotes $12 for a pack that another factory quotes at $9, the difference is rarely greed — it is a different combination of materials, labor, overhead, and margin assumptions. Buyers who cannot read the story behind the price either overpay or buy into quality problems they did not expect.
The good news: backpack cost structures are remarkably predictable once you know what to look for. This guide breaks down factory pricing from the inside — the material cost split, the labor math, the waste and yield factors, overhead and tooling, how quantity changes unit price, the hidden costs that surprise buyers, and the negotiation levers that actually work without sacrificing quality.
- The Cost Structure at a Glance
- The Material Cost Breakdown
- The Labor Cost Math
- Waste, Yield, and the Cutting Floor
- Overhead, Tooling, and the Fixed Costs
- The Hidden Costs Buyers Miss
- The Negotiation Levers That Actually Work
- Cost-Saving Strategies That Protect Quality
- The Quantity-Price Curve in Practice
- Material Price Volatility and Cost Adjustments
- The Price Bands by Pack Category
- The RFQ and Quotation Process
- From Factory Price to Retail Price: The Pricing Chain
- The Total Cost of Ownership
- The Scaling Path: From 300 to 10,000 Units
- The Cost Conversation with the Factory
- The Ten Cost Control Tactics in Practice
- FAQ
- Conclusion
The Cost Structure at a Glance
A typical backpack’s factory price breaks down into four layers:
| Layer | Typical share | What it covers |
|---|---|---|
| Materials | 55–65% | Fabric, lining, webbing, zippers, hardware, thread, labels |
| Labor | 15–25% | Cutting, sewing, assembly, packing |
| Overhead | 8–12% | Management, rent, utilities, tools, QC |
| Factory margin | 5–10% | Profit and risk allowance |
| FOB price | 100% | What you pay at the port |
Manufacturer’s note: When a quote looks impossibly cheap, one of the four layers is being cut — usually materials. When a quote looks expensive, labor, overhead, or a genuine quality system is being added. The most useful question a buyer can ask is not “why so expensive?” but “show me the breakdown.”

The Material Cost Breakdown
Materials dominate the cost — and they are where most quality differences hide.
The Material Ledger for a Standard 25 L Commuter Pack
| Component | Typical share of material cost | Notes |
|---|---|---|
| Shell fabric (600D polyester) | 25–30% | Main body, back panel |
| Lining fabric | 8–12% | Interior compartments |
| Webbing and straps | 8–12% | Shoulder straps, handles, webbing |
| Zippers | 10–15% | Main, front, pocket zippers |
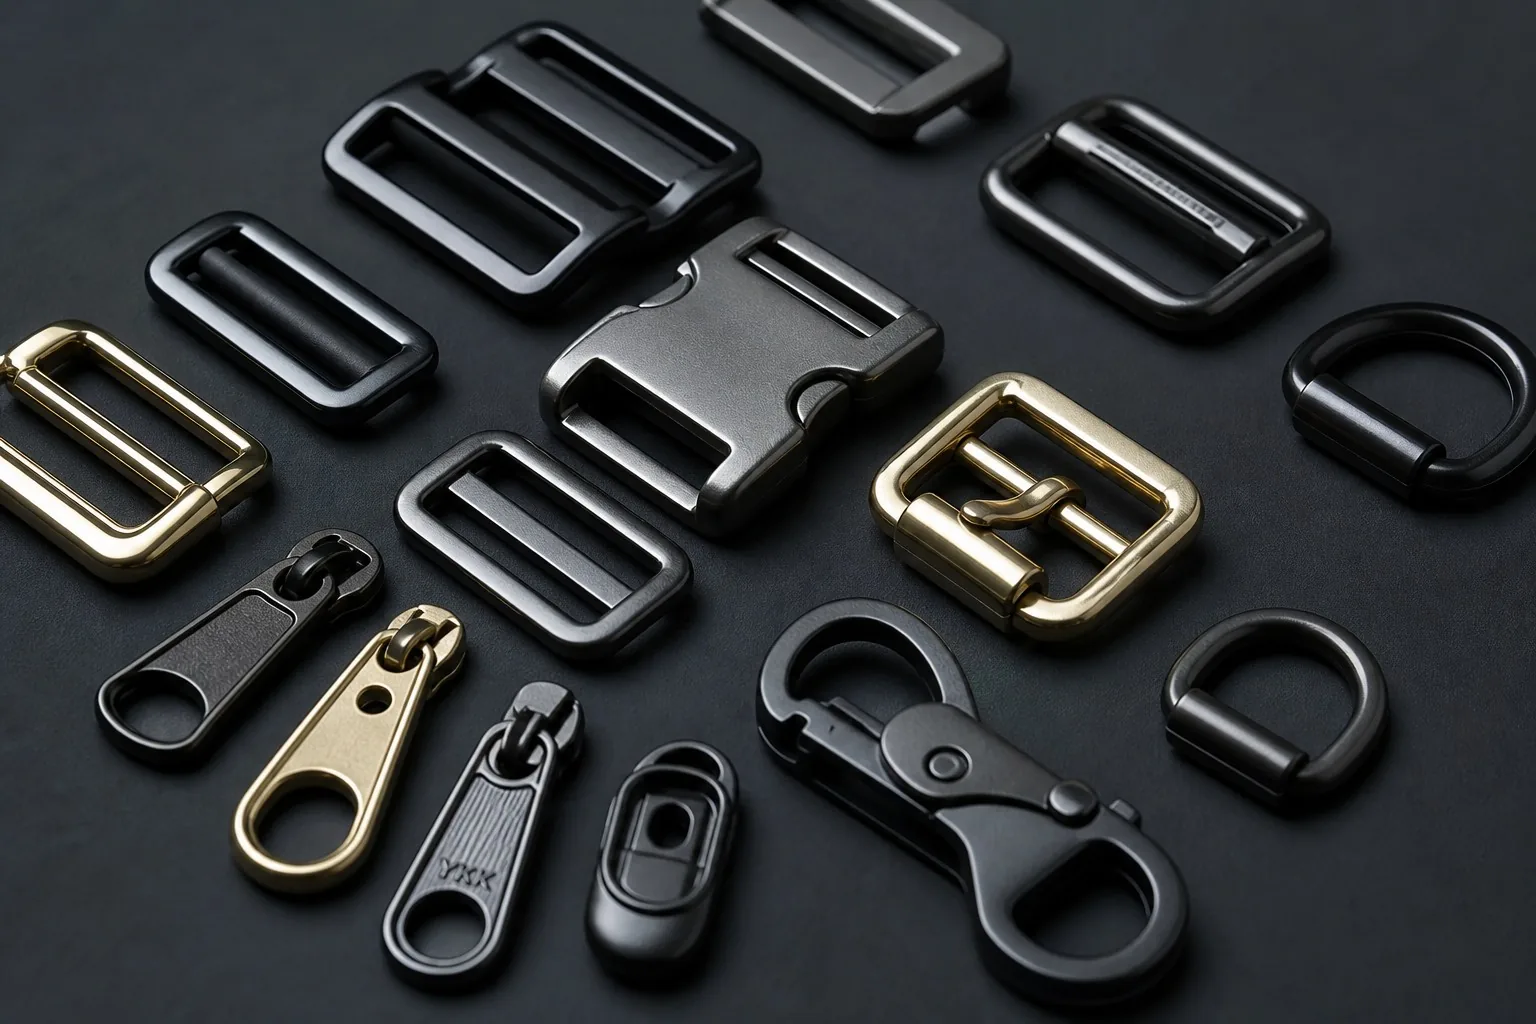
| Hardware (buckles, sliders) | 8–12% | Buckles, adjusters, D-rings |
| Foam and padding | 5–8% | Back panel, straps, laptop sleeve |
| Thread, labels, trims | 5–8% | Consumables and identification |
| Total materials | 100% | ≈55–65% of FOB price |
The Material Grade Ladder
| Grade | Example | Price index | Durability |
|---|---|---|---|
| Economy | 300D polyester, generic zippers | 1.0× | Basic |
| Standard | 600D polyester, YKK-class zippers | 1.3–1.5× | Good |
| Premium | 840D/1000D nylon, branded hardware | 1.8–2.5× | Excellent |
| Specialty | CORDURA, recycled GRS, waterproof coatings | 2.5–4× | Best |
Manufacturer’s note: The material grade is the fastest way to move a price — and the fastest way to destroy a brand if the grade is silently downgraded. Specify brands and grades in the tech pack: “600D polyester, ≥210T, PU-coated” means something; “fabric” means nothing. Every ambiguous word in the spec is a negotiation window for substitution.
The Labor Cost Math
Labor is the second-largest cost and the one buyers understand least.
The Labor Calculation
| Variable | Value |
|---|---|
| SAM (standard minutes per pack) | 30 min |
| Loaded hourly labor cost | $3.50 |
| Minutes per hour | 60 |
| Raw labor | 30 ÷ 60 × $3.50 = $1.75 |
| Efficiency factor (80%) | $1.75 ÷ 0.80 = $2.19 |
The Labor Differences by Design
| Design factor | Effect on SAM | Example |
|---|---|---|
| Number of pockets | +2–5 min each | 3 pockets vs 1 |
| Zipper count | +2–4 min each | 5 zippers vs 2 |
| Lined vs unlined | +5–10 min | Full lining |
| Padding complexity | +3–8 min | Padded laptop sleeve |
| Binding vs raw edges | +3–6 min | Bound seams |
| Hardware attachment | +1–3 min each | Multiple buckles |
The Labor Rate Reality
| Labor market | Hourly rate range |
|---|---|
| Vietnam | $1.5–2.5 |
| Indonesia | $1.0–1.8 |
| Bangladesh | $0.8–1.5 |
| China (coastal) | $2.5–4.0 |
| China (inland) | $1.8–3.0 |
| Turkey, Portugal | $5–10 |
Manufacturer’s note: A design that saves 10 minutes of SAM saves about $0.70–0.90 per pack in labor — real money at 10,000 units. Designers who understand SAM design cost-efficient packs: fewer pockets, standardized zippers, simpler linings. The cheapest design decision is made before production ever starts.

Waste, Yield, and the Cutting Floor
Material cost is calculated on theoretical consumption — but real consumption includes waste. Yield is where pricing accuracy lives or dies.
The Yield Factors
| Factor | Typical impact | Explanation |
|---|---|---|
| Nesting efficiency | 70–85% | How tightly patterns fit on the fabric |
| Directional fabric | +5–15% waste | One-way prints, pile fabrics |
| Fabric width | 140–160 cm | Wider fabric = better yield |
| Small parts | +5–10% waste | Pockets, straps eat the edges |
| Defective sections | 2–5% | Mill defects found at cutting |
| Total waste allowance | 8–20% | Added to theoretical consumption |
The Yield Example
| Item | Value |
|---|---|
| Theoretical fabric per pack | 1.2 m |
| Waste allowance (15%) | 1.38 m |
| Fabric price per meter | $3.00 |
| Actual material cost | $4.14/pack |
The Yield Questions to Ask
- What nesting software do you use, and what yield do you achieve?
- What waste percentage is in the quote?
- Do you buy fabric by the roll with width that matches my pattern?
- Can pattern changes improve yield without changing the design?
Overhead, Tooling, and the Fixed Costs
Beyond materials and labor, a factory must recover its fixed costs — and spread them over your order.
The Overhead Components
| Cost | What it is | How it scales |
|---|---|---|
| Management and admin | Supervisors, planners, office | Per order |
| Rent and utilities | Factory space, power | Per order |
| Equipment depreciation | Machines, cutting tables | Per order |
| Tooling and molds | Dies, embroidery programs, heat molds | One-time (amortized) |
| QC and testing | Inspections, lab tests | Per order |
| Packaging | Cartons, polybags, labels | Per unit |
| Insurance and finance | Working capital, risk | Per order |
The Tooling Reality
| Tooling item | Typical cost | Notes |
|---|---|---|
| Cutting dies | $50–300 each | Amortized over order |
| Embroidery program | $30–100 | One-time setup |
| Heat-press molds | $200–1,000 | Complex padding shapes |
| Pattern making | $100–500 | Development stage |
| Sample costs | $50–500 | Often credited on order |
The Fixed-Cost Spreading Effect
| Order quantity | Fixed cost per unit (assume $2,000 total) |
|---|---|
| 200 | $10.00 |
| 500 | $4.00 |
| 1,000 | $2.00 |
| 2,000 | $1.00 |
| 5,000 | $0.40 |
| 10,000 | $0.20 |
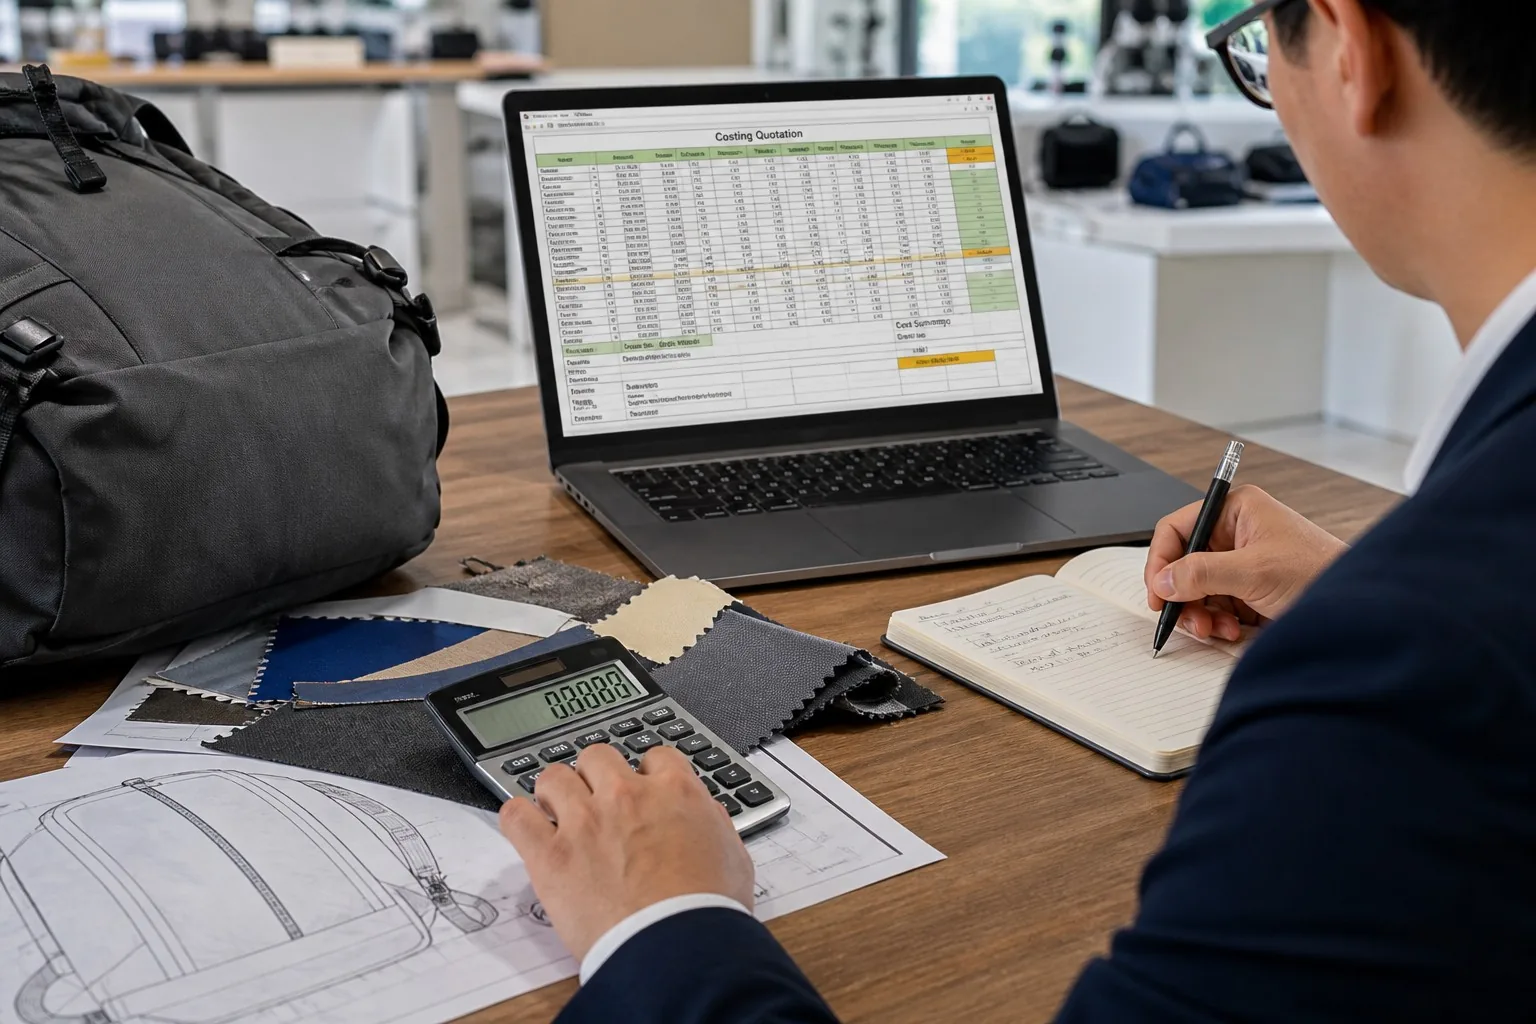
Manufacturer’s note: This is why MOQ exists. A factory quoting $18 for 300 units and $9 for 3,000 is not being inconsistent — it is spreading the same fixed costs over different quantities. Buyers who understand the curve negotiate smarter: combine styles into one order, or commit to a forecast to unlock better pricing.
The Hidden Costs Buyers Miss
Several costs appear after the quote — or silently inside it. Knowing them prevents surprises:
| Hidden cost | Where it appears | How to control it |
|---|---|---|
| Testing and certification | REACH, drop tests, lab fees | Confirm who pays before ordering |
| Sample shipping | Courier fees per round | Agree on the sample cost policy |
| Material substitutions | “Equivalent” fabric at lower grade | Spec brands/grades precisely |
| Over-production tolerance | 3–5% extra units | Agree on the tolerance in the contract |
| Packing variations | Custom cartons, inserts | Specify packaging early |
| Rework and rejects | Defective units you pay for | Inspection before shipment |
| Currency and payment fees | Exchange rates, transfer fees | Negotiate terms |
| Rush and priority fees | Compressed timelines | Plan early, avoid rushes |
The Payment Terms Effect
| Term | Who finances | Price effect |
|---|---|---|
| 30% deposit + 70% before shipment | Buyer finances little | Standard pricing |
| Net 30/60 after shipment | Factory finances | +2–5% typically |
| Letter of credit | Bank financing | +1–3% fees |
| 100% upfront | Buyer finances all | Small discount possible |
The Negotiation Levers That Actually Work
Negotiation is not about pushing the price down — it is about finding where the factory has room.
The Working Levers
| Lever | How it works | Saving potential |
|---|---|---|
| Volume commitment | Forecast-based ordering | 5–15% |
| Material specification review | Same look, better cost grade | 5–10% |
| Design simplification | Fewer pockets, standard parts | 5–15% |
| Payment terms | Faster payment for discount | 2–5% |
| Order consolidation | Multiple styles, one production run | 3–8% |
| Off-season ordering | Factory needs the work | 3–10% |
| Long-term partnership | Multi-season commitment | 3–8% |
| Packaging simplification | Standard cartons | 1–3% |
The Levers That Don’t Work
| Lever | Why it fails |
|---|---|
| Pushing below material cost | Quality is cut — silently |
| Threatening to walk | Factory discounts, then substitutes |
| Vague “market price” claims | No basis for negotiation |
| Demanding last-minute rush | Rush costs more, always |
| Never committing volume | No leverage, ever |
The Negotiation Discipline
- Get itemized quotes from 2–3 factories — compare like for like.
- Negotiate the structure, not just the total: materials, labor, tooling.
- Trade value for value: volume, payment speed, and commitment get real discounts.
- Put everything in writing — grades, brands, tolerances, terms.
- Renegotiate with data: your forecast, their performance, market benchmarks.
Cost-Saving Strategies That Protect Quality
Cutting cost is easy; cutting cost without cutting quality is a skill.
The Quality-Safe Savings
| Strategy | How it saves | What to protect |
|---|---|---|
| Optimize nesting | Less fabric waste | Yield % verified |
| Standardize hardware | Volume pricing on buckles/zippers | Brand and grade specified |
| Simplify construction | Fewer SAM minutes | Visual design unchanged |
| Consolidate colors | Fewer fabric lots | Color consistency |
| Order off-season | Better rates, more care | Schedule alignment |
| Negotiate with forecast | Volume commitment | Delivery reliability |
| Review packaging | Standard cartons | Protection in transit |
The Cost-Saving Sequence
When a buyer needs to reduce cost, the order of operations matters:
- First, review the spec — are there features adding cost without adding value? Drop them.
- Second, review materials — can a different grade achieve the same look and performance?
- Third, review construction — can SAM be reduced without visible change?
- Fourth, review quantity and timing — can volume or scheduling unlock discounts?
- Last, review the margin — negotiate the factory’s margin only after the first four are exhausted.
This sequence protects quality while finding real savings. Buyers who jump straight to “make it cheaper” get cheaper — in every sense. Buyers who work the sequence get the same quality at a better price.
The Quality-Risk “Savings” to Avoid
| Temptation | Hidden cost |
|---|---|
| Thin the fabric | Durability complaints, returns |
| Cheaper zippers | Zipper failures — the #1 complaint |
| Skip the lining | Perceived cheapness |
| Reduce padding | Comfort complaints |
| Skip QC steps | Defect rate climbs |
| Cheaper thread | Seam failures |
| No testing | Certification failures, market bans |
Manufacturer’s note: The zipper is the most returned component in backpack history. Saving $0.30 on a zipper to earn a complaint is the worst trade in the industry. The factories that build trust protect the visible and invisible quality points — and the buyers who build brands protect them too.
The Quantity-Price Curve in Practice
Let us see the full picture with one worked example:
| Quantity | Materials | Labor | Overhead/tooling | Total per unit |
|---|---|---|---|---|
| 300 | $5.50 | $2.20 | $6.67 | $14.37 |
| 1,000 | $5.50 | $2.20 | $2.00 | $9.70 |
| 3,000 | $5.20 | $2.05 | $0.67 | $7.92 |
| 10,000 | $5.00 | $1.95 | $0.20 | $7.15 |
Reading the Curve
- The curve flattens after 3,000 units — the leverage from volume diminishes.
- The biggest per-unit savings come between 300 and 1,000 units.
- Material volume discounts appear at meaningful thresholds (fabric roll multiples).
- Below MOQ, prices climb steeply — expect it and plan around it.
Material Price Volatility and Cost Adjustments
Material prices move — oil prices move polyester and nylon, metal prices move zippers and buckles, and exchange rates move everything. How the factory handles volatility determines whether your price is stable:
The Volatility Map
| Material | What moves it | Typical volatility |
|---|---|---|
| Polyester/nylon yarn | Oil price, supply | Moderate |
| PU coatings | Chemical costs | Moderate |
| Metal hardware | Copper, zinc, aluminum prices | High |
| Foam (PE/EVA) | Petrochemicals | Moderate |
| Thread | Yarn prices | Low |
| Labor (local) | Wage inflation | Low-moderate |
The Price Adjustment Mechanisms
| Mechanism | How it works | Best for |
|---|---|---|
| Fixed price for the order | Factory absorbs short-term moves | Standard orders, short lead times |
| Quarterly price review | Both sides adjust quarterly | Long programs, volatile markets |
| Material index clause | Price moves with an index | Large, long-term contracts |
| Surcharge mechanism | Shared cost increases above a threshold | Sustained spikes |
| Annual renegotiation | Reset prices once a year | Partnership programs |
The Buyer’s Protection
- Lock the price at order confirmation — in writing.
- Agree on the adjustment mechanism before prices spike.
- Know the material composition of your product — you cannot negotiate what you cannot see.
- Keep the spec precise — vague specs allow the factory to shift grades as prices rise.
- Track material indices yourself — knowledge is leverage.
Manufacturer’s note: The factories that survive price shocks are the ones with honest adjustment mechanisms — and the buyers who survive them are the ones who agreed the mechanism early. A price that “never changes” is either a price that quietly degrades or a relationship that ends at the first shock. Transparent mechanisms protect both sides.
The Price Bands by Pack Category
Knowing the realistic price bands helps buyers benchmark quotes instantly:
| Category | Typical FOB range (standard grade) | What drives it |
|---|---|---|
| Simple school pack | $4–8 | Minimal features, light fabric |
| Commuter/laptop pack | $8–15 | Padding, laptop sleeve, more zippers |
| Travel pack (structured) | $12–22 | Frames, multiple compartments |
| Outdoor/hiking pack | $15–30 | Technical fabric, load systems |
| Tactical pack | $15–35 | Heavy fabric, MOLLE, hardware |
| Leather pack (PU) | $10–20 | PU leather, simpler construction |
| Leather pack (real) | $25–60+ | Hide cost, cutting yield, skilled sewing |
| Premium/branded | $30–80+ | Branded hardware, technical materials |
Reading the Bands
- These are factory FOB prices — before freight, customs, and margin.
- Standard grade assumes 600D-class fabric and decent hardware.
- Below-band quotes mean downgraded materials or thin margins.
- Above-band quotes may mean premium materials, certification, or overhead.
The Band Check
When a quote falls outside the expected band, ask why — the answer is usually informative:
- Far below: material grade, hardware brand, or QC is being cut.
- Far above: premium materials, certifications, or a high-cost region.
- Right in band: the market is working — negotiate the details.

The RFQ and Quotation Process
A good quote starts with a good RFQ. The quality of the information you send determines the accuracy of the price you get:
The Complete RFQ Package
| Item | What to include | Why it matters |
|---|---|---|
| Tech pack | Drawings, dimensions, materials, construction | The factory cannot price what it cannot see |
| Material specs | Fabric grade, zipper brand, hardware | Prevents grade drift in the quote |
| Quantity and timeline | Order size, target delivery | Determines fixed-cost spread |
| Destination and incoterm | Port, FOB/CIF/DDP | Scope of the price |
| Packaging requirements | Carton size, labels, inserts | Affects packing cost |
| Compliance needs | Certifications, testing | Adds cost if required |
| Reference samples | Photos or physical samples | Faster, more accurate quotes |
The Quotation Timeline
| Stage | Typical duration |
|---|---|
| RFQ received | Day 0 |
| Clarification questions | Day 0–3 |
| Material costing | Day 1–5 |
| Labor calculation (SAM) | Day 2–5 |
| Quote issued | Day 3–7 |
| Quote validity | 15–30 days |
The Quote Validity Question
Material prices move, so quotes expire:
- Standard validity: 15–30 days.
- Extended validity: possible with volume commitment.
- Expired quote: re-confirm material prices before ordering.
The RFQ Mistakes That Slow Quotes
- Vague specs — the factory must guess or ask.
- Missing quantities — impossible to price fixed costs.
- No destination — incoterm is undefined.
- Multiple versions — conflicting information.
- Unrealistic timelines — quotes get padded to survive.
Manufacturer’s note: The RFQ is the first test of the buyer’s professionalism. Factories quote faster, sharper, and more honestly to buyers who send complete packages — and they price risk into quotes for buyers who do not. A complete RFQ is the cheapest discount you will ever earn.
From Factory Price to Retail Price: The Pricing Chain
The FOB price is the beginning of a chain. Understanding the whole chain protects your margins:
The Pricing Chain for a $10 FOB Pack
| Stage | Cost added | Price at stage |
|---|---|---|
| FOB price | — | $10.00 |
| Sea freight | $1.00–2.00 | $11.50 |
| Duty and taxes | 5–20% | $13.00 |
| Inland logistics | $0.50–1.00 | $14.00 |
| Landed cost | — | $14.00 |
| Wholesale margin (2–3× landed) | — | $28–42 |
| Retail margin (2–3× wholesale) | — | $56–126 |
The Margin Reality
| Channel | Typical markup over landed cost |
|---|---|
| Wholesale (B2B) | 2–3× |
| Retail (B2C) | 4–6× |
| Direct-to-consumer | 3–5× |
| Discount/outlet | Compressed |
The Landed Cost Workbook
Build a simple workbook before comparing any quotes:
| Line | Item | Value |
|---|---|---|
| 1 | FOB price per unit | $10.00 |
| 2 | Freight per unit (sea) | $1.50 |
| 3 | Duty rate × FOB | 8% = $0.80 |
| 4 | Insurance and docs | $0.30 |
| 5 | Inland delivery | $0.40 |
| 6 | Landed cost | $13.00 |
| 7 | Target wholesale | $26–39 |
| 8 | Target retail | $52–78 |
Run every candidate quote through the same workbook. The factory with the lowest FOB price does not always win the workbook — freight, duty, and quality do their own arithmetic. The workbook turns negotiation from instinct into analysis, and analysis protects margin.
The Margin Protection Rules
- Protect the FOB price: negotiate it well, but never squeeze quality.
- Watch the middle: freight, duty, and logistics often double the landed cost.
- Design to a retail price point: know the target retail price and work backward.
- Review the chain quarterly: exchange rates and freight move.
The Total Cost of Ownership
The lowest FOB price is not always the cheapest backpack. Total cost of ownership (TCO) includes everything:
| Cost element | Cheap quote | Quality quote |
|---|---|---|
| Unit price | $8.00 | $10.00 |
| Defect rate at arrival | 8% | 2% |
| Returns and claims | High | Low |
| Replacement cost | High | Minimal |
| Brand damage | Risk | Protected |
| On-time reliability | Variable | Consistent |
| True cost | Often higher | Lower over time |
The TCO Questions
- What is the defect rate at arrival inspection, on average?
- What is the factory’s on-time delivery rate?
- What happens when there is a defect — who pays for replacement?
- How does the factory handle claims — fast, fair, or resistant?
- What is the real cost of a missed season? Usually far more than the unit price saved.
Manufacturer’s note: A $2 unit saving on 5,000 units is $10,000 — real money. But a 6% defect difference on the same order can cost far more in returns, rework, and lost customers. The cheapest factory is only cheap if it delivers quality on time. Price the whole picture, not just the unit.
The Scaling Path: From 300 to 10,000 Units
Most brands start small and grow. The cost curve rewards those who plan the path:
The Growth Price Path
| Phase | Quantity | What changes | Typical price change |
|---|---|---|---|
| Startup | 300–500 | Full fixed-cost burden | Baseline |
| First growth | 1,000–2,000 | Fixed costs spread, small material discounts | −15–25% |
| Established | 3,000–5,000 | Material volume pricing, smoother runs | −25–35% |
| Scale | 10,000+ | Dedicated lines, supply chain leverage | −35–45% |
The Planning Principles
- Design for growth — a design that scales is simpler to produce at volume.
- Commit in tranches — order 3,000 as three 1,000s with a locked price schedule.
- Standardize components — the same zipper across styles unlocks hardware volume pricing.
- Share the forecast — factories buy materials better with visibility.
- Review the cost quarterly — as volumes grow, renegotiate the structure.
The Commitment Discount
A factory discounts committed volume differently from spot orders:
| Commitment | Typical discount |
|---|---|
| One order, 3,000 units | −10–15% vs 500 |
| Annual forecast, 20,000 units | −15–25% vs spot |
| Multi-season partnership | −20–30% over time |
The Cost Conversation with the Factory
The best cost results come from partnership, not pressure:
The Transparent Cost Conversation
| Practice | How it works |
|---|---|
| Share your target price point | Factory designs to the target honestly |
| Ask for the breakdown | See where the money goes |
| Propose savings jointly | Factory knows where the waste is |
| Set annual cost-down goals | Realistic, shared, measured |
| Renegotiate with data | Forecasts, volumes, market indices |
| Protect the quality floor | Agree what never gets cut |
The Annual Cost-Down Review
- Review the full year: volumes, defects, on-time performance.
- Identify cost-down opportunities: materials, labor, waste, logistics.
- Set the target: 3–8% per year is realistic for growing programs.
- Agree the mechanism: what each side changes, what is protected.
- Measure quarterly: track the savings against the target.
Manufacturer’s note: The most successful buyer-factory relationships treat cost as a shared problem. The factory knows exactly where its waste is — fabric waste, rework, idle time — and a buyer who partners on reducing it earns honest pricing for years. The buyer who merely squeezes earns a smaller price and a smaller share of the factory’s attention.
The Ten Cost Control Tactics in Practice
A quick reference of the tactics that survive contact with reality:
- Spec the fabric precisely — grade, denier, coating, brand. Vague specs invite downgrades.
- Standardize hardware — one zipper size, one buckle across styles.
- Simplify the construction — each pocket and zipper adds SAM.
- Optimize the nesting — ask the yield number, and check it on invoices.
- Consolidate orders — one production run beats three small ones.
- Commit to volume — forecasts unlock material pricing.
- Order off-season — the factory has room, and room has a price.
- Lock prices at confirmation — agree the adjustment mechanism early.
- Inspect before shipment — catching defects at the factory is cheaper than at the port.
- Review the chain — freight, duty, and logistics deserve the same scrutiny as the FOB price.
The Final Cost Checklist
Before signing any order, verify the full picture:
- [ ] Itemized quote received (materials, labor, overhead)
- [ ] Material grades and brands specified in writing
- [ ] Waste/yield percentage stated and verifiable
- [ ] Tooling and sample costs clarified (credited on order?)
- [ ] Testing and certification costs assigned
- [ ] Quantity-price curve understood for your volume
- [ ] Payment terms agreed and priced
- [ ] Price validity and adjustment mechanism confirmed
- [ ] Packaging and inspection included in scope
- [ ] TCO considered — quality and delivery, not just price
FAQ
What percentage of a backpack’s price is materials?
Typically 55–65% of the FOB price. Fabric is the largest single item (25–30% of material cost), followed by zippers and hardware. Material grade choices move the price more than any other single decision.
How is labor cost calculated in a backpack quote?
Labor = SAM (standard minutes) ÷ 60 × hourly rate ÷ efficiency. A 30-minute pack at $3.50/hour and 80% efficiency costs about $2.19 in labor. Design complexity (pockets, zippers, lining) directly raises SAM and labor.
Why is the per-unit price much higher for small orders?
Fixed costs — tooling, patterns, setup, management — are spread over the order quantity. The same $2,000 in fixed costs adds $10/unit at 200 pieces but only $0.20/unit at 10,000. The quantity-price curve flattens around 3,000 units.
How can I reduce backpack cost without hurting quality?
Optimize nesting to cut fabric waste, standardize hardware for volume pricing, simplify construction to save sewing time, consolidate colors, order off-season, commit to volume for better rates, and review packaging. Avoid thin fabric, cheap zippers, and skipped QC — those savings create returns.
What hidden costs should I expect in backpack production?
Testing and certification fees, sample courier costs, material substitution risks, over-production tolerance, custom packaging, rework, currency fees, and rush premiums. Confirm each in the quote or contract before ordering.
What does MOQ mean for pricing?
MOQ is the minimum order a factory will produce at the quoted price. Below it, per-unit cost climbs steeply because fixed costs spread thinner. If your volume is below MOQ, combine styles, negotiate with a forecast, or find a factory whose MOQ matches your scale.
How do I compare quotes fairly?
Standardize the spec (grades, brands, features), the terms (incoterm, port), and the breakdown (materials, labor, overhead). Compare the structure, not just the total. Ask each factory what the price includes — testing, packaging, inspection — so the comparison is apples to apples.
Conclusion
Backpack pricing is transparent once you know the anatomy: materials dominate at 55–65%, labor follows at 15–25%, and overhead, tooling, and margin complete the picture. Quantity spreads the fixed costs, design complexity drives the labor, and material grades drive the quality — and the price.
The buyers who negotiate well do not squeeze blindly; they understand where the factory has room — volume, standardization, timing, and commitment — and they protect the quality points that build their brand. A fair price with a clear breakdown builds a partnership; a magical price with a vague breakdown builds a problem.
We quote every backpack with a full breakdown — materials by component, labor by SAM, tooling and testing made visible. Ask us for the story behind our price, not just the number.