Backpack Field Failure Analysis and Warranty Handling
Backpack Field Failure Analysis and Warranty Handling
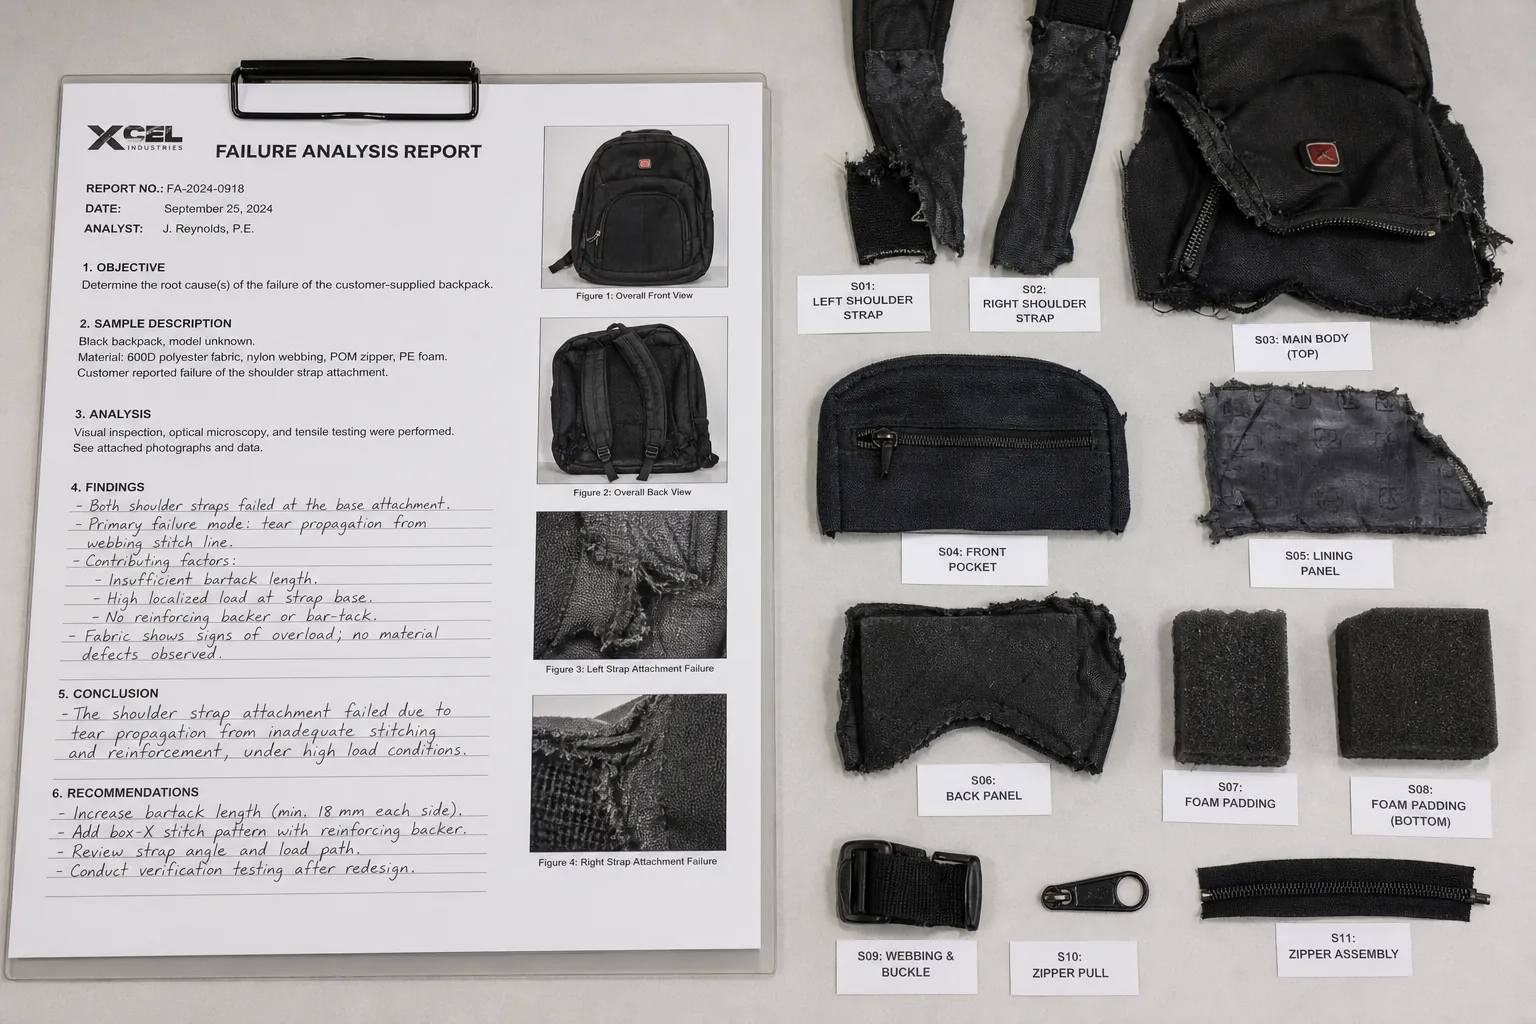
A backpack that fails in the field carries more information than any inspection report. It has survived real loads, real weather, and real handling, and it failed for a specific reason that can be identified, quantified, and designed out of the next production run.
Most factories treat warranty claims as a cost to be minimised. The better approach treats them as the only free product research a manufacturer ever receives. A return rate of two percent with a documented failure mode is a design input. The same two percent with no analysis is simply a bill.
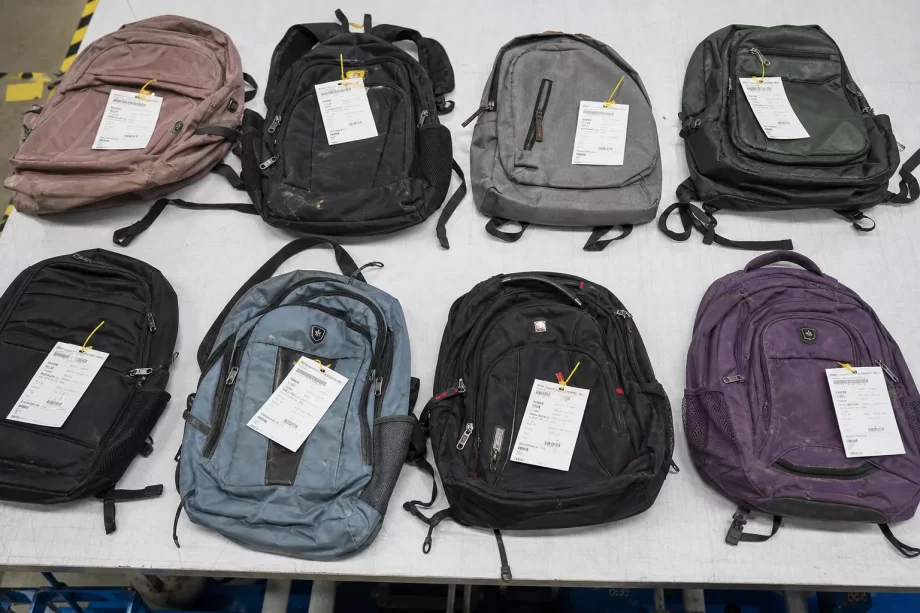
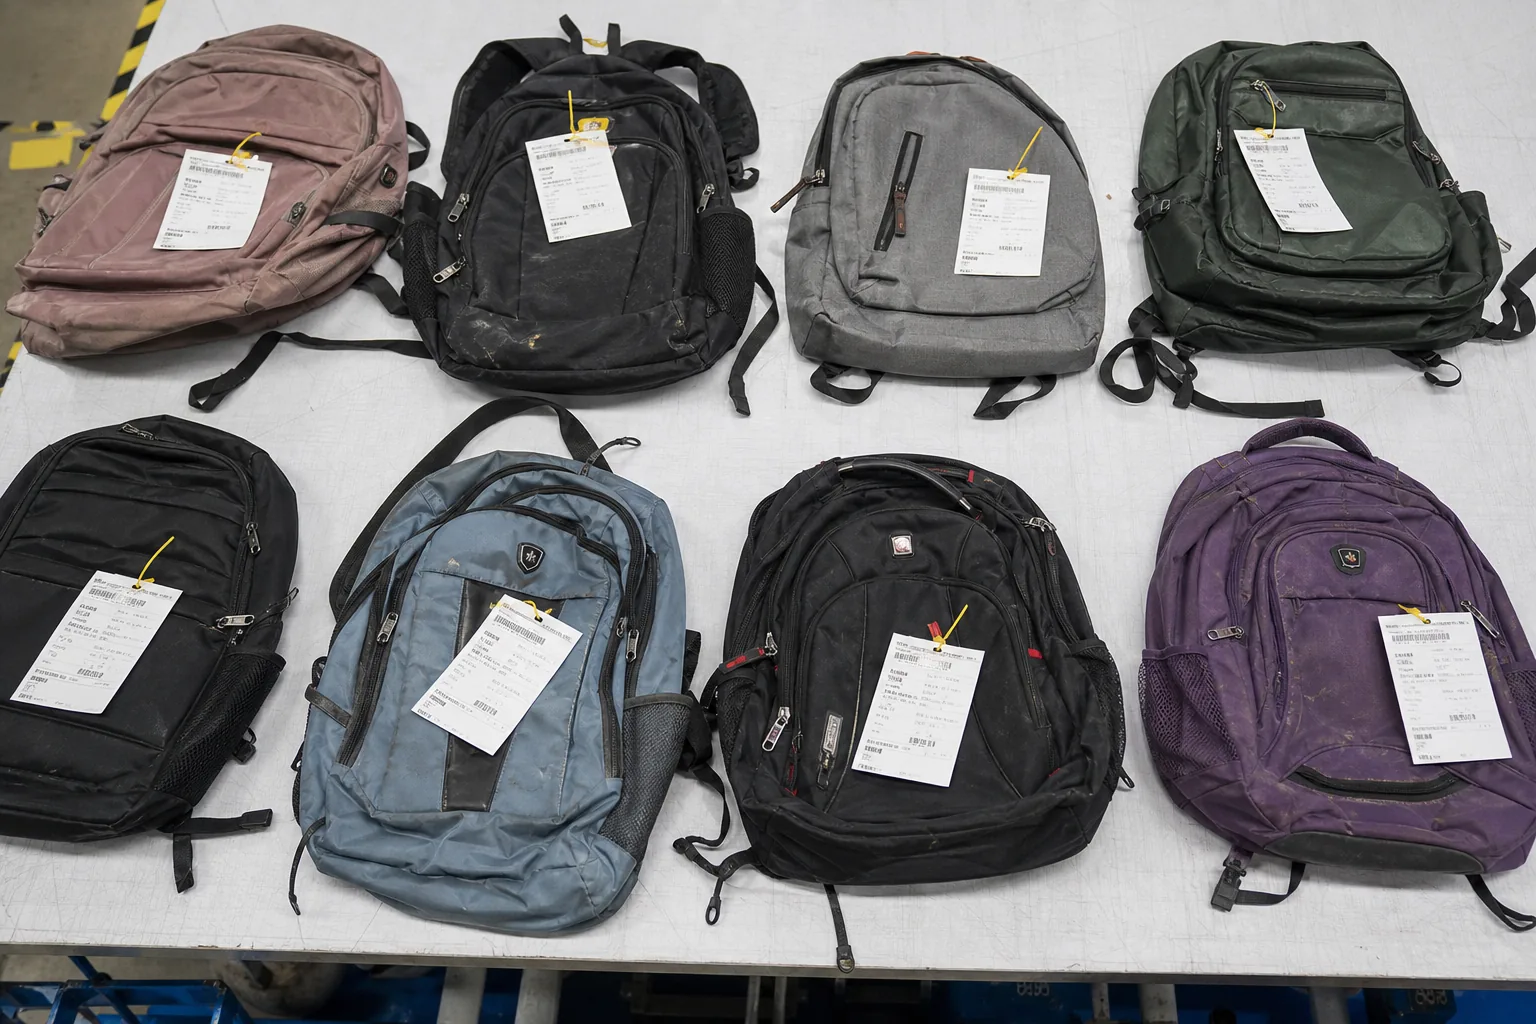
Returned backpacks tagged for inspection in a quality lab
This guide covers field failure analysis and warranty handling from a manufacturing perspective: how failures are categorised, how an analysis process is built, the diagnostic methods that establish root cause, how warranty terms are designed to be enforceable, how a claim is processed step by step, and how the findings are fed back into design and production.
Warranty claims are the only channel through which a factory learns how its products behave after they leave the building. Every other data point is a proxy.
The Value of Failure Data
Value
Explanation
Design feedback
Reveals which features fail
Process feedback
Reveals which operations drift
Material feedback
Reveals which specifications underperform
Cost control
Directs improvement spending
Customer retention
Demonstrates accountability
Competitive position
Builds an evidence base
The Cost of Ignoring It
Consequence
Effect
Repeating the same defect
Accumulating claims
Blind cost cutting
Removing the wrong margin
Customer loss
Buyer switches suppliers
Reputation damage
Slower new business
Warranty reserve uncertainty
Financial exposure
The Data Sources
Source
Information
Returned units
Physical evidence
Customer photos
Usage context
Claim descriptions
Failure symptoms
Retailer reports
Aggregate patterns
Support tickets
Frequency data
Social and review data
Unreported failures
The Signal vs Noise Table
Signal
Action
Rising claim rate on one component
Investigate the component
Claims concentrated in one market
Investigate the climate or usage
Claims concentrated in one lot
Investigate production
Random low-level claims
Monitor, no action
One-off severe failure
Investigate, may be user-caused
The Reporting Bias Table
Bias
Effect
Only severe failures reported
Understates minor defects
Only recent purchases reported
Hides delayed failures
Retailer filtering
Distorts the sample
Customer self-repair
Removes evidence
Unreported minor failures
Understates the true rate
The Failure Cost Layers
Layer
Cost type
Replacement product
Direct material and labour
Freight
Logistics
Retailer handling
Administrative
Customer goodwill
Relationship
Brand impact
Reputation
Investigation
Engineering time
The Cost Comparison Table
Response
Cost
Learning
Replace without analysis
Highest
None
Repair without analysis
Moderate
Low
Analyse then replace
Moderate
High
Analyse and correct production
Front-loaded
Highest
Factory note: A claim is evidence, not an accusation. Factories that ask for the failed unit and analyse it gain something their competitors do not have: a documented reason why a product fails in the field, in a specific market, under specific conditions. That knowledge is worth more than the cost of the replacement.
Classification of Backpack Failures
Failures must be classified before they can be counted. A consistent taxonomy is the foundation of every later analysis.
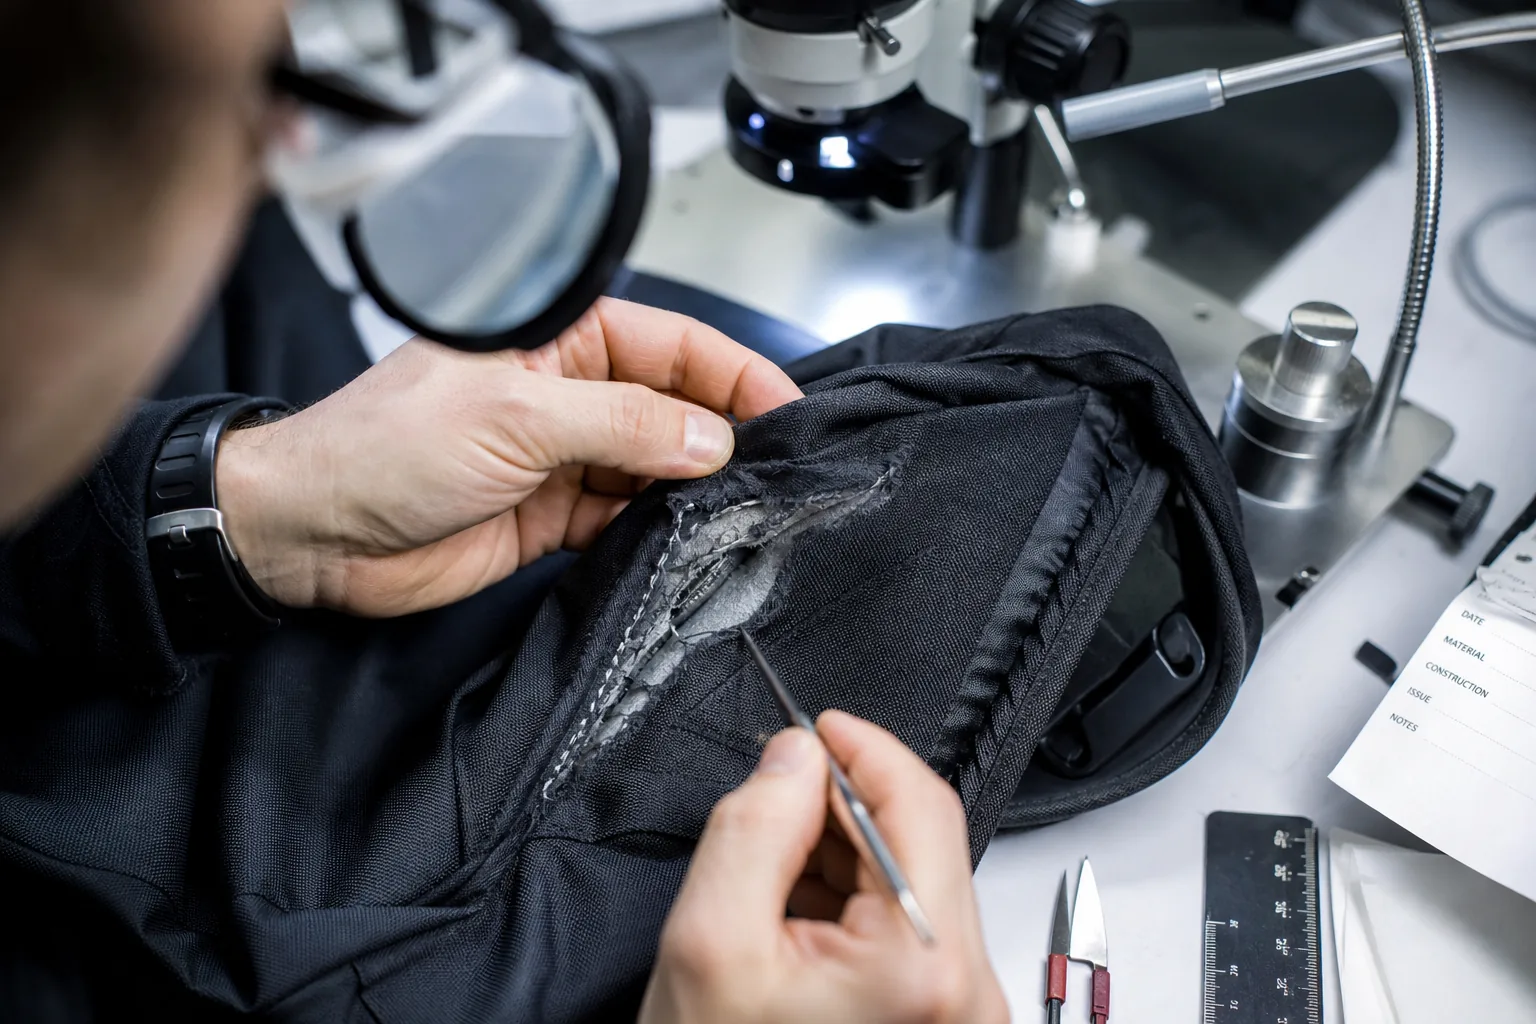
Failed backpack seam opened for inspection on a lab bench
The Primary Failure Categories
Category
Definition
Structural
Load-bearing element fails
Closure
Zipper or fastening fails
Attachment
Component detaches
Material
Fabric or coating fails
Cosmetic
Appearance degrades
Functional
Product no longer performs its task
The Detailed Classification Table
Failure
Category
Typical cause
Strap tears at the anchor
Structural
Insufficient reinforcement
Zipper slider breaks
Closure
Component quality
Zipper track separates
Closure
Poor alignment or stress
Buckle cracks
Attachment
Material or load
Seam opens
Structural
Stitch density or thread
Coating peels
Material
Adhesion or age
Fabric abrades through
Material
Abrasion resistance
Lining tears
Material
Lining weight
Logo falls off
Cosmetic
Adhesion
Colour fades
Cosmetic
Light fastness
Water enters
Functional
Seam or coating failure
Padding compresses
Functional
Foam specification
The Severity Classification Table
Severity
Definition
Warranty treatment
Critical
Safety risk
Replace or recall
Major
Product unusable
Repair or replace
Moderate
Function impaired
Repair
Minor
Appearance affected
Assess per policy
Negligible
Cosmetic only
Advice only
The Attribution Table
Cause
Responsibility
Material defect
Material supplier
Manufacturing defect
Factory
Design deficiency
Brand and factory jointly
Normal wear
Customer expectation
Misuse or overload
Customer
Normal ageing
Customer expectation
The Wear vs Defect Table
Indicator
Wear
Defect
Failure location
High-stress area
Any location
Failure pattern
Gradual
Sudden
Adjacent material
Uniformly worn
Intact
Time in service
Long
Short
Multiple units
Random
Clustered
The Failure Mode Priorities
Priority
Failure modes
Safety related
Strap anchor, buckle, harness
Function critical
Zipper, seam, coating
Comfort related
Padding, foam, lining
Cosmetic
Logo, colour, hardware finish
The Field vs Lab Table
Observation
Meaning
Lab test passes, field fails
Test did not replicate usage
Lab test fails, field passes
Test is too severe
Both fail
Definition or specification
Neither fails but claims continue
Wrong failure mode investigated
The Repeat Failure Table
Pattern
Meaning
Same component, different markets
Component specification
Same component, same market
Usage pattern plus specification
Same lot only
Production deviation
Same factory, different brands
Factory process
Across all suppliers
Design or expectation
The Claim Volume Threshold Table
Claim rate
Action
Under 0.5 percent
Monitor
0.5 to 2 percent
Investigate the pattern
2 to 5 percent
Formal corrective action
Above 5 percent
Production hold and review
The Return and Claim Intake Process
A claim is only useful if the unit and its context reach the analysis stage intact. Intake discipline decides whether that happens.
The Intake Steps
Step
Action
1
Receive the claim with the unit
2
Record the claim details
3
Photograph before handling
4
Tag the unit with an identifier
5
Record the production code
6
Store in a dedicated area
7
Route to analysis
The Intake Record Table
Field
Content
Claim identifier
Unique reference
Product and model
Model code
Production code
Lot and date
Purchase date
Customer-stated
Failure date
Customer-stated
Failure description
Customer words
Usage context
Where and how used
Photographs
Before handling
Market
Destination
The Tagging Table
Tag element
Purpose
Unique number
Identity
Claim reference
Link to records
Date received
Age of evidence
Storage location
Retrieval
Photos on file
Confirmation
The Production Traceability Table
Question
Source
What lot is this?
Production code
Which materials?
Material records
Which operator or line?
Production log
Which inspection result?
Quality records
Which supplier batch?
Incoming records
The Storage Requirements Table
Requirement
Reason
Dry, clean area
Prevent further degradation
Away from sunlight
Prevent colour change
Segregated from production
Prevent mixing
Labelled shelving
Retrieval
Retention period defined
Evidence availability
The Intake Quality Table
Issue
Effect
Unit discarded
No physical evidence
Code not recorded
No traceability
No photographs
No usage context
Mixed storage
Evidence contamination
Delayed intake
Degraded condition
The Customer Communication Table
Stage
Message
Claim received
Acknowledgement and timeline
Unit requested
Reason for the request
Analysis complete
Findings summary
Resolution agreed
Outcome and logistics
Factory note: The single highest-value habit in warranty handling is asking for the failed unit back before deciding anything. A photograph shows the symptom; the unit shows the mechanism. Factories that routinely receive and open failed units build a failure library that no amount of inspection data can replace.
Root Cause Analysis Methods
Root cause analysis converts a failed unit into an actionable production or design change. The method matters less than the discipline of following it to a verifiable cause.
The Analysis Methods
Method
Use case
Five whys
Simple, single-cause failures
Fishbone diagram
Multi-factor failures
Fault tree analysis
Safety-related failures
Comparative analysis
Lot-to-lot differences
Design of experiments
Parameter-related failures
Failure mode and effects analysis
Preventive, design stage
The Method Comparison Table
Method
Depth
Effort
Best for
Five whys
Moderate
Low
Recurring simple defects
Fishbone
Broad
Moderate
Assembly defects
Fault tree
Deep
High
Safety failures
Comparative
Moderate
Moderate
Lot-specific defects
Design of experiments
Deep
High
Process parameter faults
FMEA
Preventive
High
New product development
The Five Whys Example Table
Level
Question and answer
Symptom
Strap tore at the anchor
Why 1
The reinforcement was insufficient
Why 2
The specified bar-tack count was not applied
Why 3
The machine operator skipped a pass
Why 4
The operation is manual with no verification
Why 5
No in-process check exists for the bar-tack count
The Fishbone Categories
Category
Factors
Material
Fabric, thread, hardware, foam
Machine
Setting, calibration, maintenance
Method
Sequence, parameters, specification
Operator
Skill, training, fatigue
Measurement
Inspection, gauges, records
Environment
Humidity, temperature, handling
The Evidence Types Table
Evidence
Question it answers
Physical examination
What failed and how
Photographs
Where and in what condition
Measurement
Dimensions and tolerances
Material testing
Specification conformity
Production records
What was actually made
Comparative samples
Deviation from the standard
The Physical Examination Steps
Step
Activity
1
Photograph the unit as received
2
Record all visible damage
3
Identify the primary failure point
4
Check for secondary damage
5
Compare against a new sample
6
Open the failure site if needed
7
Document with photographs
8
Retain the sample
The Comparative Analysis Table
Comparison
Insight
Failed vs new unit
What changed
Failed vs other lot
Production deviation
Failed vs competitor product
Design benchmark
Failed vs specification
Conformance
Failed vs test sample
Test validity
The Verification Rule Table
Rule
Reason
Reproduce the failure
Confirms the mechanism
Change one variable
Isolates the cause
Verify the fix on samples
Confirms the correction
Re-test after the fix
Prevents regression
Document the evidence
Traceability
The Common Analysis Errors
Error
Consequence
Stopping at the first plausible cause
Wrong correction
Blaming the operator
Systemic cause missed
No comparative sample
No baseline
Skipping documentation
Findings lost
Analysing only severe claims
Pattern missed
No reproduction attempt
Cause unverified
The Documentation Table
Record
Content
Analysis report
Findings and conclusion
Photographs
Numbered and labelled
Measurements
Recorded values
Test results
Laboratory data
Root cause statement
Verified cause
Corrective action
Specific change
Verification result
Evidence of effectiveness
Inspection and Laboratory Techniques
Physical analysis uses a small set of techniques that can be performed in a factory laboratory or sent to a specialist.
The Techniques
Technique
Purpose
Visual examination
Identify the failure site
Magnification
Reveal the mechanism
Tensile testing
Measure joint strength
Abrasion testing
Assess wear resistance
Colour fastness
Assess fading
Coating adhesion test
Assess delamination
Water resistance test
Assess waterproofing
Microscopy
Fibre or coating examination
The Technique Selection Table
Failure
Techniques
Seam opening
Visual, magnification, tensile
Zipper failure
Visual, dimensional, functional
Strap tearing
Visual, tensile, comparative
Coating peel
Adhesion test, microscopy
Fabric abrasion
Abrasion test, comparative
Colour fade
Fastness test
Water ingress
Water test, seam inspection
Buckle breakage
Visual, load test, material analysis
The Measurement Table
Measurement
Instrument
Stitch density
Stitch counter
Seam strength
Tensile tester
Fabric weight
Balance
Coating thickness
Gauge
Hardware dimensions
Calipers
Foam density
Weight and volume
The Comparative Test Table
Sample
Purpose
Failed unit
The subject
Production sample
Reference standard
Competitor sample
Benchmark
Specification sample
Conformance
Retained sample from the lot
Actual production
The Laboratory Capability Table
Capability
Where performed
Visual and dimensional
Factory
Tensile and seam strength
Factory or external
Abrasion
External
Colour fastness
External
Coating adhesion
Factory or external
Microscopy
External
Chemical analysis
External
The Test Report Table
Field
Content
Sample identity
Claim reference
Test method
Standard referenced
Test conditions
Temperature and humidity
Result
Measured value
Reference value
Specification or standard
Conclusion
Pass, fail, or inconclusive
The Evidence Retention Table
Item
Retention
Failed samples
Per warranty period
Photographs
Permanent
Analysis reports
Permanent
Test reports
Per warranty period
Comparative samples
Per season
Factory note: The most under-used technique in bag failure analysis is the comparative sample. Pulling a unit from the same lot and comparing it against the failed unit side by side reveals whether the failure is a production deviation or a design limitation. That single comparison usually determines whether the fix belongs in the production line or in the design department.
Warranty Policy Design
Warranty terms must be specific enough to be administered consistently and realistic enough to be honoured. Vague terms create disputes; generous terms without analysis create losses.
The Policy Elements
Element
Content
Coverage period
Duration
Covered failures
Definitions
Exclusions
What is not covered
Remedy
Repair, replace, or credit
Claim process
Steps and timeline
Evidence required
Unit and documentation
Shipping responsibility
Who pays
Discretion
Who decides
The Coverage Period Table
Product level
Typical period
Value pack
6 to 12 months
Standard pack
1 to 2 years
Technical pack
2 to 5 years
Lifetime claim
Ambiguous, avoid
Commercial use
Often excluded
The Coverage Scope Table
Failure type
Usually covered
Manufacturing defect
Yes
Material defect
Yes
Workmanship
Yes
Normal wear
No
Misuse
No
Accident damage
No
Cosmetic ageing
Usually not
The Exclusion Table
Exclusion
Wording need
Overloading
Maximum load stated
Improper care
Care instructions referenced
Unauthorised repair
Clear prohibition
Commercial use
Definition of commercial
Cosmetic wear
Distinguish from defect
Consequential loss
Explicitly limited
The Remedy Hierarchy Table
Remedy
When appropriate
Repair
Localised, repairable failure
Replace like for like
Manufacturing defect
Replace with equivalent
Model discontinued
Credit note
No replacement available
Refund
Where required by law
The Claim Timeline Table
Stage
Target
Claim acknowledgement
Within a few days
Unit requested
With the acknowledgement
Analysis completion
Within two weeks
Decision communicated
Within three weeks
Resolution dispatched
Within four weeks
The Responsibilities Table
Party
Responsibility
Customer
Report and return
Retailer
Receive and forward
Brand
Decide and communicate
Factory
Analyse and correct
The Discretion Table
Situation
Decision rule
Wear versus defect unclear
Analyse the unit
Policy silent on the failure
Apply the intent of the policy
Repeat claim from one customer
Analyse for misuse
High-value customer
Commercial decision
Safety-related failure
Always investigate
The Policy Communication Table
Channel
Content
Packaging insert
Coverage summary
Website
Full terms
Retailer brief
Process steps
Support script
Consistent responses
Factory note: A warranty clause is only useful if the factory can administer it. A three-year coverage promise on a component that has a documented one-year field life creates a predictable future liability. Field failure data should inform the warranty period rather than the marketing department setting it independently.
Handling a Claim Step by Step
A repeatable process protects both the customer relationship and the factory’s ability to learn from the failure.
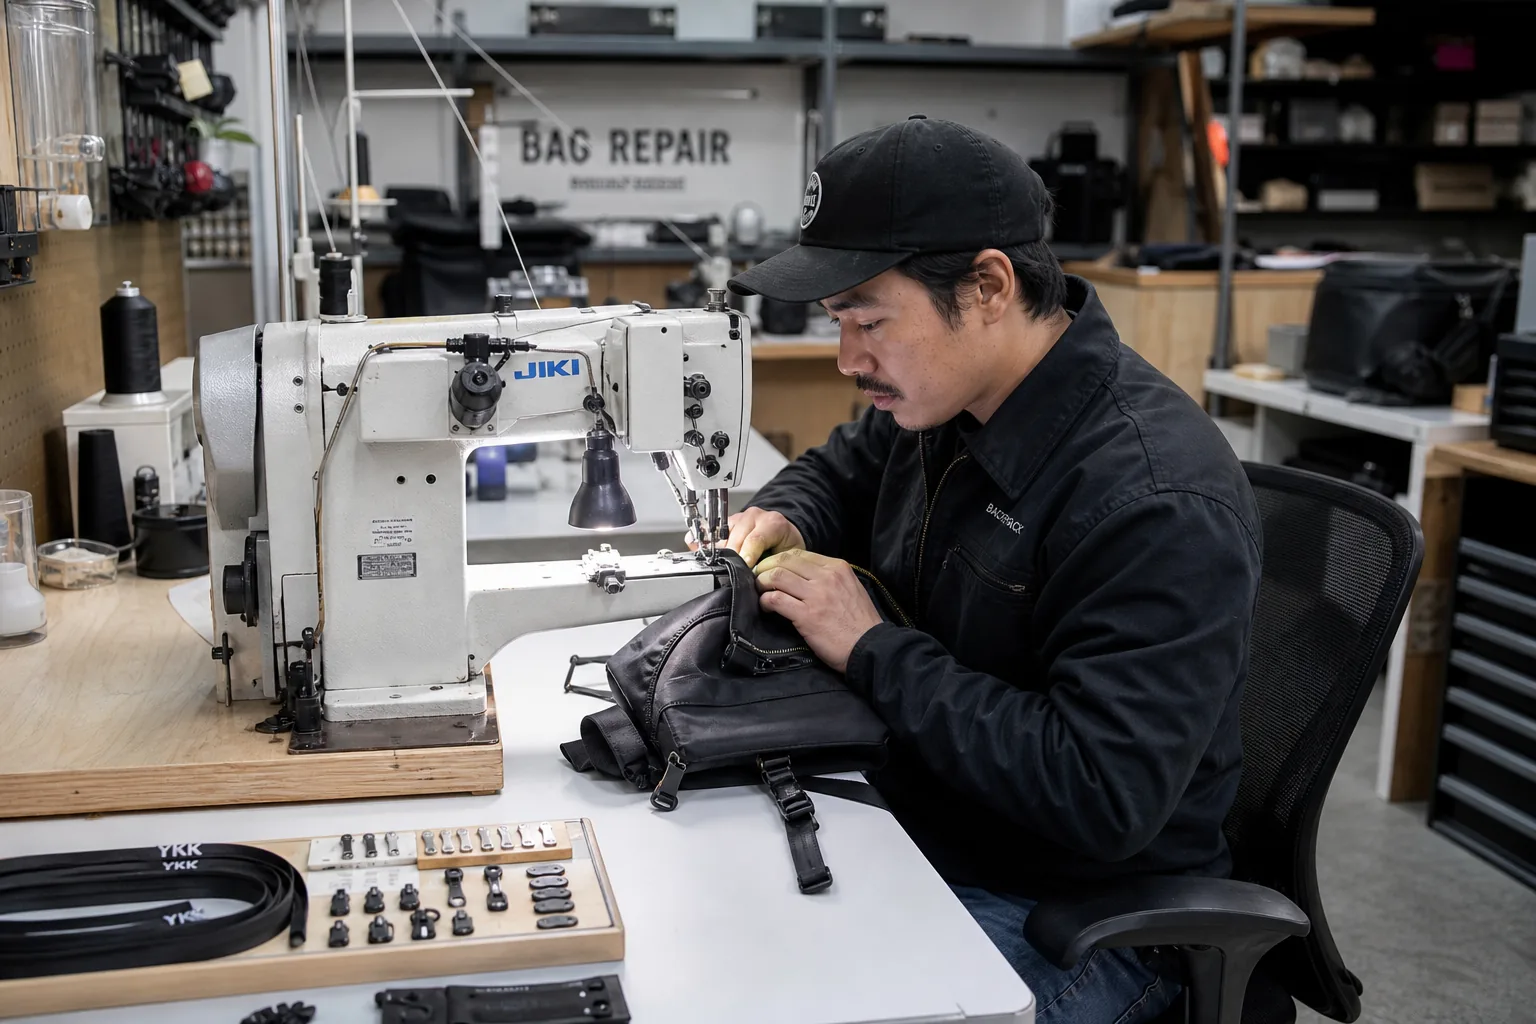
Technician repairing a backpack zipper at a factory repair station
The Processing Steps
Step
Action
Owner
1
Receive and log the claim
Retailer or customer service
2
Request the unit and details
Customer service
3
Register in the claim system
Quality
4
Photograph and tag
Quality
5
Trace the production code
Production records
6
Perform the analysis
Quality laboratory
7
Determine the attribution
Quality and engineering
8
Decide the remedy
Brand or factory per agreement
9
Execute the remedy
Logistics and production
10
Record the outcome and close
Quality
The Claim Status Table
Status
Meaning
Logged
Claim registered
Awaiting unit
Unit not yet received
Under analysis
Examination in progress
Awaiting decision
Findings complete
Resolution agreed
Remedy selected
Closed
Resolved and recorded
The Decision Matrix
Failure type
Attribution
Remedy
Manufacturing defect
Factory
Replace
Material defect
Supplier
Replace and recover cost
Design deficiency
Joint
Replace and redesign
Normal wear
Customer
Offer paid repair
Misuse
Customer
Decline with explanation
Safety related
Investigate
Investigate regardless of attribution
The Response Time Table
Claim value
Response expectation
Low value, clear defect
Fast replacement
Moderate value
Analysis then replace
High value
Full analysis and case review
Safety related
Immediate escalation
The Escalation Table
Trigger
Escalation
Safety risk
Immediate to management
Media or social exposure
Immediate to management
Repeat claim from one market
Pattern review
Claim rate threshold exceeded
Corrective action project
Legal threat
Legal and management
The Customer Outcome Table
Outcome
Communication
Replacement issued
Confirmation and tracking
Repair performed
Work description
Claim declined
Explanation and evidence
Partial remedy
Terms explained
The Record Closure Table
Record
Content
Claim file
All documents
Analysis report
Findings
Action taken
Remedy executed
Cost recorded
Financial posting
Corrective action link
If applicable
The Process Metrics Table
Metric
Purpose
Claim rate by product
Pattern detection
Claim rate by lot
Production control
Time to resolution
Service level
Cost per claim
Financial planning
Repeat claim rate
Effectiveness
Factory note: The claim decision should never be made before the unit is examined. Replacing on description alone trains the market to describe failures generously, and it forfeits the analysis opportunity. A short, polite request for the unit is a normal part of a professional warranty process.
Repair, Replace or Decline
Each claim requires a commercial decision. A decision matrix removes the inconsistency that damages both margin and relationships.
The Decision Factors
Factor
Consideration
Failure attribution
Who caused it
Repairability
Can it be restored
Repair cost versus replacement
Financial threshold
Product availability
Is a replacement available
Customer relationship
Commercial value
Legal obligation
Local consumer law
Precedent
Effect on future claims
The Repairability Table
Failure
Repairable
Zipper replacement
Yes
Strap anchor reinforcement
Yes
Seam restitching
Yes
Coating delamination
Usually not
Fabric abrasion hole
Sometimes
Cracked buckle
Replace the component
Foam collapse
Usually not
Frame breakage
Usually not
The Repair Economy Table
Repair cost as share of product value
Decision
Under 25 percent
Repair
25 to 50 percent
Repair if the customer prefers
50 to 75 percent
Replace
Above 75 percent
Replace
The Local Repair Consideration Table
Option
Advantage
Factory repair
Controlled quality
Local repair partner
Fast and low freight
Retailer repair
Immediate
Customer self-repair
Lowest cost, quality risk
The Decline Table
Reason to decline
Evidence needed
Overloading
Load marks or customer statement
Misuse
Damage pattern
Unauthorised repair
Repair marks
Normal wear
Comparative sample
Out of period
Purchase record
The Goodwill Table
Situation
Goodwill option
Slightly out of warranty
Discounted repair
Wear-related failure
Paid repair service
High-value customer
Case-by-case remedy
Reputation-sensitive
Commercial decision
The Prevention Table
Prevention
Effect
Clear load limits
Fewer overload claims
Care instructions
Fewer misuse claims
Quality components
Fewer closure claims
Reinforcement at stress points
Fewer structural claims
Supplier Accountability and Cost Recovery
When a failure originates with a supplied component or material, the cost should be recovered under the supply agreement.
The Recovery Basis Table
Cause
Recovery basis
Material non-conformity
Purchase agreement
Component defect
Purchase agreement
Wrong shipment
Purchase agreement
Supplier process change without notice
Contract clause
Labelling error
Purchase agreement
The Evidence Requirement Table
Evidence
Purpose
Failed sample
Physical proof
Test report
Conformance data
Production code
Traceability to the batch
Comparative sample
Deviation proof
Purchase record
Supply chain proof
The Contract Clauses Table
Clause
Purpose
Conformity warranty
Defines the obligation
Notification period
Sets the claim window
Evidence provision
Requires documentation
Cost recovery
Allocates the cost
Corrective action obligation
Requires a fix
Audit right
Enables verification
The Recovery Process Table
Step
Action
1
Confirm the failure origin
2
Quantify the cost
3
Notify the supplier within the period
4
Provide the evidence
5
Agree the recovery method
6
Verify the corrective action
The Recovery Methods Table
Method
Use
Credit note
Simple, low value
Replacement supply
Component failures
Cost sharing
Shared attribution
Price adjustment
Ongoing relationship
The Ongoing Relationship Table
Approach
Long-term effect
Evidence-based claim
Supplier accepts and corrects
Blame without evidence
Relationship damage
No claim at all
Repeated failures
Systematic scorecarding
Supplier improvement
The Supplier Scorecard Table
Metric
Weight indication
Incoming quality
High
Claim contribution
High
Response to claims
Moderate
Corrective action effectiveness
High
Documentation completeness
Moderate
Feeding Findings Back into Design and Production
Analysis has no value until it changes something. The corrective action loop is what converts a warranty cost into an improved product.
A structured library turns individual cases into institutional knowledge that outlives the people who analysed them.
The Library Contents
Element
Purpose
Case records
Individual failures
Photographs
Visual evidence
Physical samples
Tangible reference
Analysis reports
Findings
Corrective actions
What was changed
Outcome data
Effectiveness
The Case Record Table
Field
Content
Case number
Unique reference
Product
Model and code
Failure mode
Classification
Root cause
Verified cause
Attribution
Responsible party
Corrective action
Change made
Outcome
Result after change
The Sample Library Table
Sample type
Value
Failed unit
Reference for the failure
Correct construction
Comparison standard
Competitor product
Benchmark
Revised design
Improvement record
Historical sample
Design evolution
The Access Table
User
Use
Design team
Avoid repeating mistakes
Production
Reference standard
Quality
Inspection criteria
Sales
Evidence of improvement
Training
Real case teaching
The Library Maintenance Table
Activity
Frequency
New case entry
On completion
Photograph archiving
On completion
Sample condition check
Annually
Index update
Quarterly
Review of closed cases
Annually
Metrics and Reporting
Warranty performance must be measured consistently. Without metrics, improvement cannot be demonstrated.
The Core Metrics
Metric
Definition
Claim rate
Claims divided by units sold
Failure rate by mode
Claims per failure type
Cost per claim
Total cost divided by claims
Warranty reserve
Provision for expected claims
Time to resolution
Days from claim to close
Repeat rate
Claims on replaced units
The Calculation Table
Metric
Formula
Claim rate
Claims in period divided by units shipped in period
Mode share
Claims of one mode divided by total claims
Cost per claim
Total claim cost divided by claim count
Reserve rate
Expected claim cost divided by revenue
Resolution time
Sum of resolution days divided by claim count
The Reporting Frequency Table
Report
Frequency
Claim log
Weekly
Pattern review
Monthly
Cost report
Monthly and quarterly
Corrective action status
Monthly
Management review
Quarterly
The Benchmark Table
Comparison
Purpose
Against the previous period
Trend
Against the target
Performance
Against other products
Weak model detection
Against the industry norm
Market position
Against suppliers
Sourcing decisions
The Dashboard Table
Indicator
Threshold
Claim rate
Target defined per product
Top failure mode
Watch the top three
Cost per claim
Trend
Open corrective actions
Age limit
Resolution time
Service target
The Root Cause Reporting Table
Field
Content
Case reference
Identity
Failure mode
Classification
Root cause
Verified cause
Attribution
Responsibility
Action taken
Corrective step
Verification
Evidence
The Warranty Cost Model
Warranty cost is a predictable expense when the claim rate and the average resolution cost are known.
The Cost Components
Component
Content
Replacement product cost
Material and labour
Freight
Outbound and return
Handling
Administrative labour
Repair cost
Where applicable
Disposal
For non-repairable returns
Investigation
Engineering time
The Cost Model Table
Factor
Input
Units sold
Volume
Claim rate
Percentage
Average replacement cost
Currency
Average freight cost
Currency
Administrative cost
Currency
Expected reserve
Percentage of revenue
The Reserve Table
Product maturity
Reserve approach
New product
Higher initial reserve
Established product
Historical claim rate
Revised product
Blend of history and expectation
End-of-life product
Declining reserve
The Cost Reduction Table
Lever
Mechanism
Reduce the claim rate
Design and process improvement
Reduce unit cost per claim
Repair instead of replace
Reduce freight
Local repair networks
Reduce administrative cost
Automated claims processing
Recover from suppliers
Evidence-based claims
The Investment Table
Investment
Expected return
Failure analysis capability
Faster root cause
Repair station
Lower cost per claim
Improved components
Lower claim rate
Training
Fewer repeat defects
Test equipment
Earlier defect detection
The Planning Table
Planning period
Information need
Short term
Reserve for open claims
Medium term
Trend-based forecast
Long term
Design improvement plan
Factory note: The reserve is not a financial abstraction; it is a direct consequence of design and process decisions. A product with a documented two percent claim rate and a twenty-dollar average resolution cost has a forty-cent per unit liability before it ships. Managing that number means managing design, sourcing, and process together.
The Buyer and Factory Checklist
One checklist covering the decisions that determine whether failures are managed or merely paid for.
System Setup
Item
Done
Claim classification taxonomy defined
☐
Claim intake process documented
☐
Unique claim identifiers in use
☐
Production traceability available
☐
Analysis capability established
☐
Failure library created
☐
Per Claim
Item
Done
Unit requested and received
☐
Photographs taken before handling
☐
Production code traced
☐
Comparative sample pulled
☐
Physical examination completed
☐
Root cause established
☐
Attribution determined
☐
Remedy executed
☐
Record closed
☐
Corrective Action
Item
Done
Containment applied where needed
☐
Specification updated
☐
Verification sample tested
☐
Claim rate monitored after the change
☐
Supplier notified where applicable
☐
Cost recovered where applicable
☐
The Seven Rules
Rule
Reason
Always ask for the failed unit
Physical evidence drives the fix
Classify before counting
Consistent data is usable data
Pull a comparative sample
Separates defect from design limit
Verify the root cause by reproduction
Prevents wrong corrections
Set the warranty period from field data
Avoids unmanageable liability
Close the loop with a specification change
Prevents recurrence
Track the metrics after the fix
Proves effectiveness
FAQ
Should a factory replace a failed backpack without analysing it?
No. Replacing on the customer’s description alone forfeits the only physical evidence of the failure and trains the market to describe failures generously. The standard approach is to acknowledge the claim, request the unit, analyse it, and then decide the remedy. Where a fast replacement is commercially necessary, request the unit anyway so the analysis can still be completed.
How do you tell the difference between a defect and normal wear?
Location, pattern, and comparison. A defect typically appears at an unexpected location or on a lightly stressed area, fails suddenly, and shows intact adjacent material. Normal wear appears in high-stress areas, develops gradually, and shows uniform degradation across the surrounding material. Comparing the failed unit against a new unit from the same production lot is the most useful single check.
What information should be recorded when a claim is received?
The unique claim identifier, the product and model, the production code, the customer-stated purchase and failure dates, the failure description in the customer’s own words, the usage context, the market, and photographs taken before any handling. The production code is the most important field because it links the unit to material batches, production logs, and inspection records.
How many failed units are needed to identify a pattern?
One unit identifies a failure mechanism; three to five units with the same mechanism establish a pattern. In practice, a rising claim rate on a single component is usually detectable before a large sample is available, and that early signal is enough to justify a formal investigation. Waiting for statistical confidence delays the correction.
What is a reasonable warranty period for a backpack?
Value packs commonly carry six to twelve months, standard packs one to two years, and technical packs two to five years. The period should be set from field failure data rather than from marketing ambition, because a coverage promise longer than the component’s demonstrated field life creates a predictable future liability. Commercial use is usually treated separately or excluded.
How do you recover warranty costs from a component supplier?
Confirm the failure originates with the supplied component, quantify the cost, notify the supplier within the contractual notification period, and provide the evidence: the failed sample, a test report, the production code linking to the supplied batch, and a comparative sample. Recovery then takes the form of a credit note, replacement supply, or a price adjustment depending on the agreement.
Why does a failure that passes laboratory testing still appear in the field?
Because the laboratory test did not replicate the actual usage. Typical gaps are load direction, cycle count, abrasion against real surfaces, exposure to ultraviolet light, and the combination of loads applied at once. When laboratory tests pass but field claims continue, the test protocol is the item that needs revision, not the specification alone.
How quickly should a warranty claim be resolved?
A workable target is acknowledgement within a few days, analysis completion within two weeks, a decision communicated within three weeks, and the resolution dispatched within four weeks. Safety-related failures and claims with media or social exposure should escalate immediately and follow a separate, faster track.
What should be done when the same failure appears in one production lot only?
Treat it as a production deviation and trace the lot. Compare the failed unit against units from a different lot and against the retained sample from the same lot, then review the production log, operator records, machine calibration records, and incoming material records for that period. The corrective action belongs in the production process, not in the design.
Conclusion
Field failure analysis is the only process that tells a manufacturer how its product actually behaves. Every inspection, test, and audit is an approximation of field conditions; a returned unit is the field condition itself.
The discipline has four parts. Classify failures consistently so the data can be counted, and analyse them physically with a comparative sample alongside the failed unit.
That comparison is what makes the difference between a production deviation and a design limitation visible. Design the warranty terms around the field evidence so the promise is administrable rather than aspirational, then close the loop by changing a specification, a work instruction, or a component and tracking the claim rate to confirm the change worked.
For factories, a functioning failure analysis system is a commercial asset. It shortens investigations, supports evidence-based cost recovery from suppliers, and allows the plant to state with confidence what its products do under real use.
For buyers, the leverage is in the intake discipline: insist on receiving the failed unit, require a documented root cause before agreeing a remedy, and treat every claim as an input to the next production run rather than a cost to be absorbed. A backpack that fails is expensive. A backpack that fails without being understood is expensive twice.