Choosing a backpack factory is usually the largest single risk decision a bag brand makes. A wrong choice shows up months later as late shipments, inconsistent quality, or a supplier that cannot scale when the order grows.
Most brands evaluate factories informally — a few emails, a sample set, a price comparison — and then formalise nothing. The result is a relationship managed by impression rather than evidence, and disputes resolved by whoever argues harder.
Buyer auditor inspecting a backpack factory production floor
This guide covers the structure that replaces that guesswork: supplier scorecards that make performance comparable, factory audits that verify what a scorecard cannot show, and the development process that turns an average supplier into a reliable one.
A structured evaluation costs a few days of effort. An unstructured relationship costs years of margin.
The Cost of a Wrong Supplier
Failure mode
Business impact
Late shipment
Missed season, markdowns
Inconsistent quality
Returns, chargebacks
No capacity headroom
Refused growth orders
Unstable materials
Constant re-sampling
Poor communication
Endless email loops
Compliance failure
Blocked shipment, penalties
What Evaluation Prevented
Risk
Evaluation method
Under-capacity supplier
Capacity verification
Weak quality system
Factory audit
Financial instability
Business background check
Non-compliance
Certification review
Poor responsiveness
Sample and quotation stage
Hidden subcontracting
On-site verification
The Evaluation Cost Table
Activity
Effort
Value
Desk research
2–4 hours
Screens obvious mismatches
Questionnaire
1 hour per supplier
Comparable data
Sample order
2–4 weeks
Reveals real capability
On-site audit
1–2 days
Verifies claims
Trial order
4–8 weeks
Full-system test
Reference checks
2 hours
Reveals reputation
The Evaluation Dimensions
Dimension
Question answered
Capability
Can they build this product
Capacity
Can they build this volume
Quality system
Can they build it consistently
Cost structure
Is the price sustainable
Compliance
Are they legally usable
Communication
Will the project run smoothly
Financial health
Will they survive the program
The Buying Stages
Stage
Evaluation depth
Sourcing search
Desk research
Shortlist
Questionnaire
Finalist
Audit and samples
Approved
Trial order
Ongoing
Scorecard reviews
Factory note: The most expensive supplier decision is not the one with the highest price — it is the one that fails mid-season. A factory that audits well, communicates promptly, and holds capacity for your program is worth a higher unit price than one that quotes lower and delivers late.
Building a Supplier Scorecard
A scorecard converts judgement into numbers, so suppliers can be compared on the same basis and improvement can be tracked over time.
The Scorecard Structure
Category
Weight
Why it matters
Quality
25%
Determines returns and claims
Delivery
20%
Protects the launch schedule
Cost
15%
Affects margin
Capacity and lead time
15%
Enables growth
Compliance
15%
Legal and retail access
Communication
10%
Project speed and problem solving
The Weighting Rationale
Business priority
Adjustment
Fast fashion cycle
Raise delivery weight
Premium brand
Raise quality weight
Cost-driven program
Raise cost weight
Regulated market
Raise compliance weight
Scaling brand
Raise capacity weight
The Quality Scorecard Items
Item
Measure
Lot rejection rate
Percentage
Major defect rate
Defects per unit
Critical defects
Count, target zero
Corrective action closure
Percentage closed on time
Repeat defects
Same cause recurrence
Sample first-pass approval
Percentage
The Delivery Scorecard Items
Item
Measure
On-time shipment
Percentage
Lead time adherence
Days variance
Sample turnaround
Days
Documentation timeliness
Percentage
Response to schedule changes
Rating
The Cost Scorecard Items
Item
Measure
Price competitiveness
Against benchmark
Cost stability
Change over 12 months
Hidden cost frequency
Claims and shortfalls
Cost reduction proposals
Count per year
Payment term flexibility
Rating
The Compliance Scorecard Items
Item
Measure
Certifications valid
Yes or no
Audit grade
Score
Corrective findings closed
Percentage
Chemical compliance
Test records
Labor practice findings
Count
The Scoring Scale
Score
Rating
Meaning
90–100
A
Preferred supplier
80–89
B
Approved, monitor
70–79
C
Conditional, improve
60–69
D
At risk, corrective plan
Under 60
E
Not approved
The Weighted Score Example
Category
Weight
Score
Contribution
Quality
25%
92
23.0
Delivery
20%
85
17.0
Cost
15%
78
11.7
Capacity
15%
90
13.5
Compliance
15%
95
14.3
Communication
10%
88
8.8
Total
100%
—
88.3
The Review Cadence Table
Frequency
Review
Per lot
Quality result
Monthly
Delivery and quality metrics
Quarterly
Full scorecard
Annually
Strategic review
The Data Sources
Data
Source
Quality
Inspection reports
Delivery
Shipment records
Cost
Purchase orders
Capacity
Factory declarations and audits
Compliance
Certificates and audit reports
Communication
Project team feedback
The Common Scorecard Mistakes
Mistake
Effect
Too many categories
Nobody uses it
Equal weights for all
Ignores business priorities
Scoring without data
Opinion dressed as measurement
No feedback to supplier
No improvement
Never updated
Loses relevance
Used as a weapon
Destroys the relationship
Factory note: A scorecard only improves a supplier if the supplier sees it. Sharing the weighted result, the weak category, and the improvement target converts a scoring exercise into a development tool — and most factories respond to a clear, fair measurement better than to a vague complaint.
Types of Factory Audits
Audits verify what documents cannot. Different audit types answer different questions, and most programs need more than one.
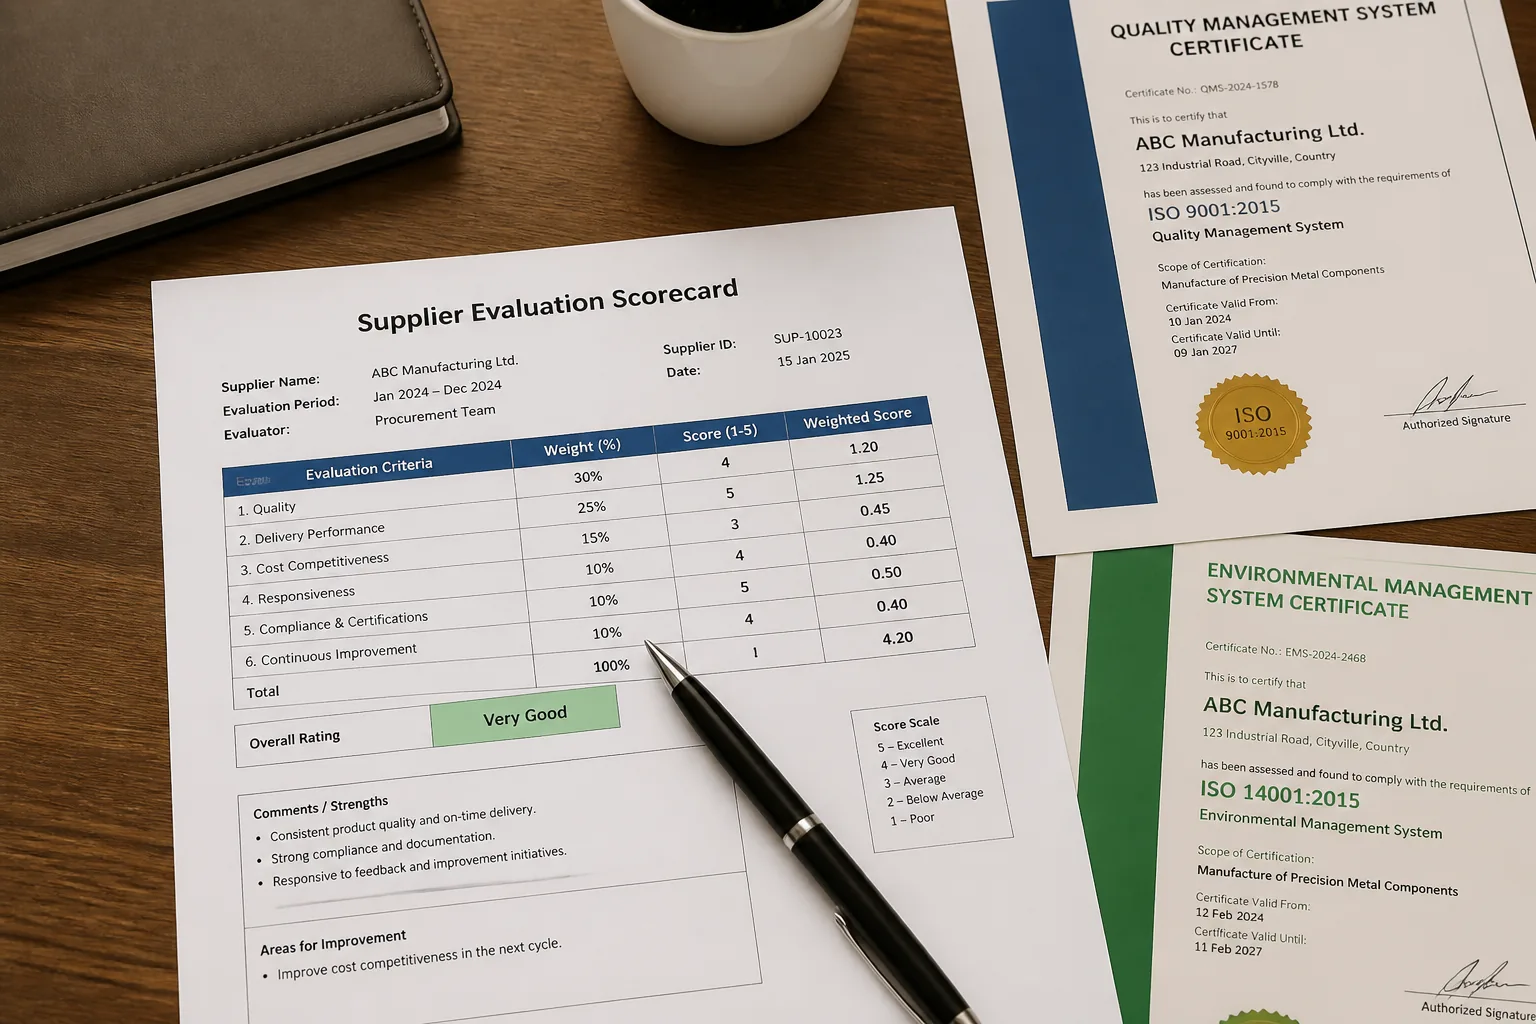
Supplier evaluation scorecard document on an office desk
The Audit Types
Audit type
Question answered
Capability audit
Can they make this product
Quality system audit
Can they make it consistently
Social compliance audit
Are labor conditions acceptable
Environmental audit
Is environmental practice compliant
Security audit
Is the supply chain secure
Financial audit
Is the business stable
The Audit Comparison Table
Audit
Duration
Frequency
Typical owner
Capability
4–8 hours
Before approval
Brand
Quality system
1–2 days
Annual
Brand or third party
Social compliance
1–2 days
Annual
Third party
Environmental
1 day
Annual
Third party
Security
1 day
Annual or per request
Third party
Financial
Desk review
Before approval
Brand
The Capability Audit Scope
Area
Verified
Machinery
Type, age, count, condition
Skills
Sample quality, operator skill
Technical staff
Pattern makers, technicians
Materials
Sources, stock, quality control
Sampling
Process and lead time
Capacity
Realistic monthly output
The Quality System Audit Scope
Area
Verified
Incoming inspection
Records and method
In-line control
Checks and frequency
Final inspection
Standard and sample plan
Corrective action
System and closure
Traceability
Lot identification
Calibration
Measuring tool records
Training
Records and skills matrix
The Social Compliance Topics
Topic
Check
Working hours
Records match reality
Wages
Paid on time, at legal minimum
Child labor
Age verification
Forced labor
Freedom of movement
Health and safety
Equipment, training, exits
Freedom of association
Worker representation
Grievance mechanism
Accessible and used
The Announcement Question
Audit style
Advantage
Disadvantage
Announced
Cooperation, planning
Prepared appearance
Semi-announced
Balance
Some preparation
Unannounced
Reality
Access resistance
The Audit Team Composition
Role
Responsibility
Lead auditor
Scope, scoring, report
Technical specialist
Process verification
Compliance specialist
Labor and environment
Brand representative
Requirement clarification
Interpreter
Communication
The Audit Evidence Standard
Evidence
Requirement
Documents
Originals, dated, signed
Records
Complete and consistent
Photographs
Dated, location visible
Interviews
Multiple levels of staff
Observation
Actual process, not staged
Samples
Produced during the visit
The Audit Scoring Scale
Score
Rating
Consequence
90 plus
Excellent
Preferred status
80–89
Good
Approved
70–79
Acceptable
Minor corrective actions
60–69
Weak
Corrective plan required
Under 60
Unacceptable
Not approved
The Corrective Action Timeline
Finding class
Timeline
Critical
Immediate or stop production
Major
30 days
Minor
60–90 days
Observation
Next review
Factory note: An audit is not a test to pass — it is a shared look at the system. Factories that prepare by implementing the standard rather than by rehearsing for the visit improve their real performance, and they typically score better on unannounced follow-ups than on the first announced audit.
Executing a Factory Audit
The value of an audit depends on what the auditor actually verifies, not on the length of the report.
The Audit Sequence
Step
Activity
1
Opening meeting and scope
2
Factory tour
3
Document review
4
Process observation
5
Worker interviews
6
Sample and measurement checks
7
Scoring and findings
8
Closing meeting
9
Written report
10
Corrective action follow-up
The Factory Tour Checks
Area
What to observe
Cutting room
Equipment, spreading, records
Sewing floor
Machine types, layout, WIP
Assembly
Sequence, fixtures, balance
Finishing
Hardware, trimming, cleaning
Inspection
Lighting, standard, records
Warehouse
Material control, storage
Packing
Method, marking, cartons
The Document Review List
Document
Verified
Business license
Valid and matching
Certifications
Current, correct scope
Quality manual
Exists and used
Inspection records
Complete, consistent
Training records
Dated, named
Payroll records
Consistent with hours
Material certificates
From actual suppliers
Calibration records
Current
The Consistency Checks
Check
Method
Machine count claimed
Count on the floor
Staffing claimed
Compare with records
Capacity claimed
Calculate from machines
Output claimed
Review shipping records
Order book claimed
Ask about current loading
Customer claims
Request references
The Capacity Reality Check
Input
Value
Machines on floor
Count
Working hours
Verify
Line efficiency
Estimate from observation
Realistic monthly output
Calculate
Claimed capacity
Compare
Utilization
Ask about booked orders
The Subcontracting Question
Signal
Meaning
Output above capacity
Work is outsourced
Machines idle at peak
Production is elsewhere
Unfamiliar style in progress
Not their own order
Separate unit not toured
Hidden process
Address on label differs
Undisclosed site
The Interview Technique
Rule
Reason
Speak privately
Honest answers
Multiple workers
Pattern, not anecdote
Ask about process, then rights
Builds rapport
Check records against statements
Verification
Avoid management presence
Removes pressure
The Evidence Quality Table
Evidence
Strength
System records
Strong if consistent
Direct observation
Strong
Multiple interviews
Moderate to strong
Single interview
Weak
Documents only
Weak
Verbal assurance
Very weak
The Audit Report Format
Section
Content
Scope
Areas and criteria covered
Methodology
Methods used
Findings
By category with evidence
Non-conformities
Classified by severity
Score
Against the scale
Photographs
Dated and captioned
Corrective actions
Required with deadlines
Conclusion
Approval recommendation
Documents and Certificates
Certificates are the fastest way to filter suppliers and the easiest thing to fake. Verification matters more than possession.
Factory certificates and compliance records in a binder
The Certificate Types
Certificate
Covers
ISO 9001
Quality management system
ISO 14001
Environmental management
BSCI or Sedex
Social compliance
WRAP
Responsible production
SA8000
Social accountability
GRS
Recycled content
OEKO-TEX
Restricted substances
B Corp
Overall responsibility
The Verification Steps
Step
Method
Check the certificate number
Issuer database
Confirm the legal entity name
Against business license
Check the scope
Product and process match
Check validity dates
Current
Confirm the issuing body
Accredited
Ask for the audit report
Not just the certificate
The Document Red Flags
Red flag
Implication
Certificate name differs from company
Different entity
Expired certificate presented
Not current
Scope excludes your product
Not covered
Issuer not traceable
Possibly forged
Report never available
Certificate only
Photocopy of a photocopy
Source unclear
The Material Documentation Chain
Document
Purpose
Mill certificate
Fiber content and performance
Test report
Physical performance
Chemical test
Restricted substances
Recycled content certificate
Claim support
Traceability record
Chain of custody
Purchase records
Actual sourcing
The Traceability Questions
Question
Purpose
Which mill supplies this fabric
Verify the chain
Can we see the purchase order
Confirm reality
Which tannery for leather
Confirm source
Are substances tested per batch
Confirm consistency
Who conducts the testing
Confirm independence
The Testing Requirement Table
Market
Common requirement
EU
REACH compliance
US
CPSIA where applicable
California
Proposition 65
Retailer-specific
RSL testing
Recycled claims
GRS or equivalent
The Document Control Standards
Requirement
Why
Retrievable within minutes
Shows real system
Version controlled
Prevents outdated use
Retained for a defined period
Supports claims
Accessible to responsible staff
Functional system
Updated when processes change
Accuracy
The Audit Trail Principle
Every claim should be traceable to a document, and every document should be traceable back to reality. When a certificate exists but the purchase records do not support it, the certificate is decoration.
Red Flags and Risk Signals
Most supplier failures announce themselves before they happen. The signals are visible to anyone who looks for them.
The Operational Red Flags
Signal
Risk
WIP piled everywhere
Poor control
No visible inspection standard
Quality drift
Untidy, disorganised floor
Weak management
Machines idle at peak season
Capacity claim doubtful
Tools missing or improvised
Method instability
No work instructions
Inconsistent output
The Management Red Flags
Signal
Risk
Owner unavailable during audit
Limited transparency
Records produced on request only
System not live
Different answers from different staff
Poor internal control
Resistance to worker interviews
Concealment
No corrective action history
No improvement culture
Frequent management turnover
Instability
The Commercial Red Flags
Signal
Risk
Price far below market
Material or labor compromise
Price far above market
Inefficiency or positioning
Reluctance to quote terms
Hidden costs
Payment terms demanded upfront
Cash flow pressure
Sudden capacity offers
Subcontracting
No customer references
Unproven
The Compliance Red Flags
Signal
Risk
Certificate matches a different name
Entity mismatch
No chemical testing records
Regulatory exposure
Underage-looking workers, no age records
Serious violation
Locked exits or blocked stairs
Safety violation
Excessive overtime recorded
Ethical and quality risk
No environmental permits
Compliance exposure
The Communication Red Flags
Signal
Risk
Slow responses before the order
Worse after
No single point of contact
Project confusion
Verbal-only commitments
Nothing enforceable
Avoids written specification changes
Cost surprises
Disagrees with documented standards
Dispute risk
The Risk Scoring Table
Signal count
Risk level
Action
0–1
Low
Proceed
2–3
Moderate
Clarify in writing
4–5
High
Corrective plan required
6 plus
Severe
Do not proceed
The Verification Actions
Suspected issue
Verification
Capacity overstated
Ask for shipment records
Subcontracting
Request an unannounced visit
Material substitution
Test an unannounced sample
Compliance gap
Request the full report
Financial weakness
Business background check
Factory note: Experienced buyers watch the floor, not the presentation. The condition of the cutting room, the presence of written work instructions, the amount of work-in-progress, and whether control documents can be produced in minutes tell more about a factory than any slide deck.
Supplier Development and Improvement
Evaluation identifies gaps. Development closes them, and it is where the real return on an audit program sits.
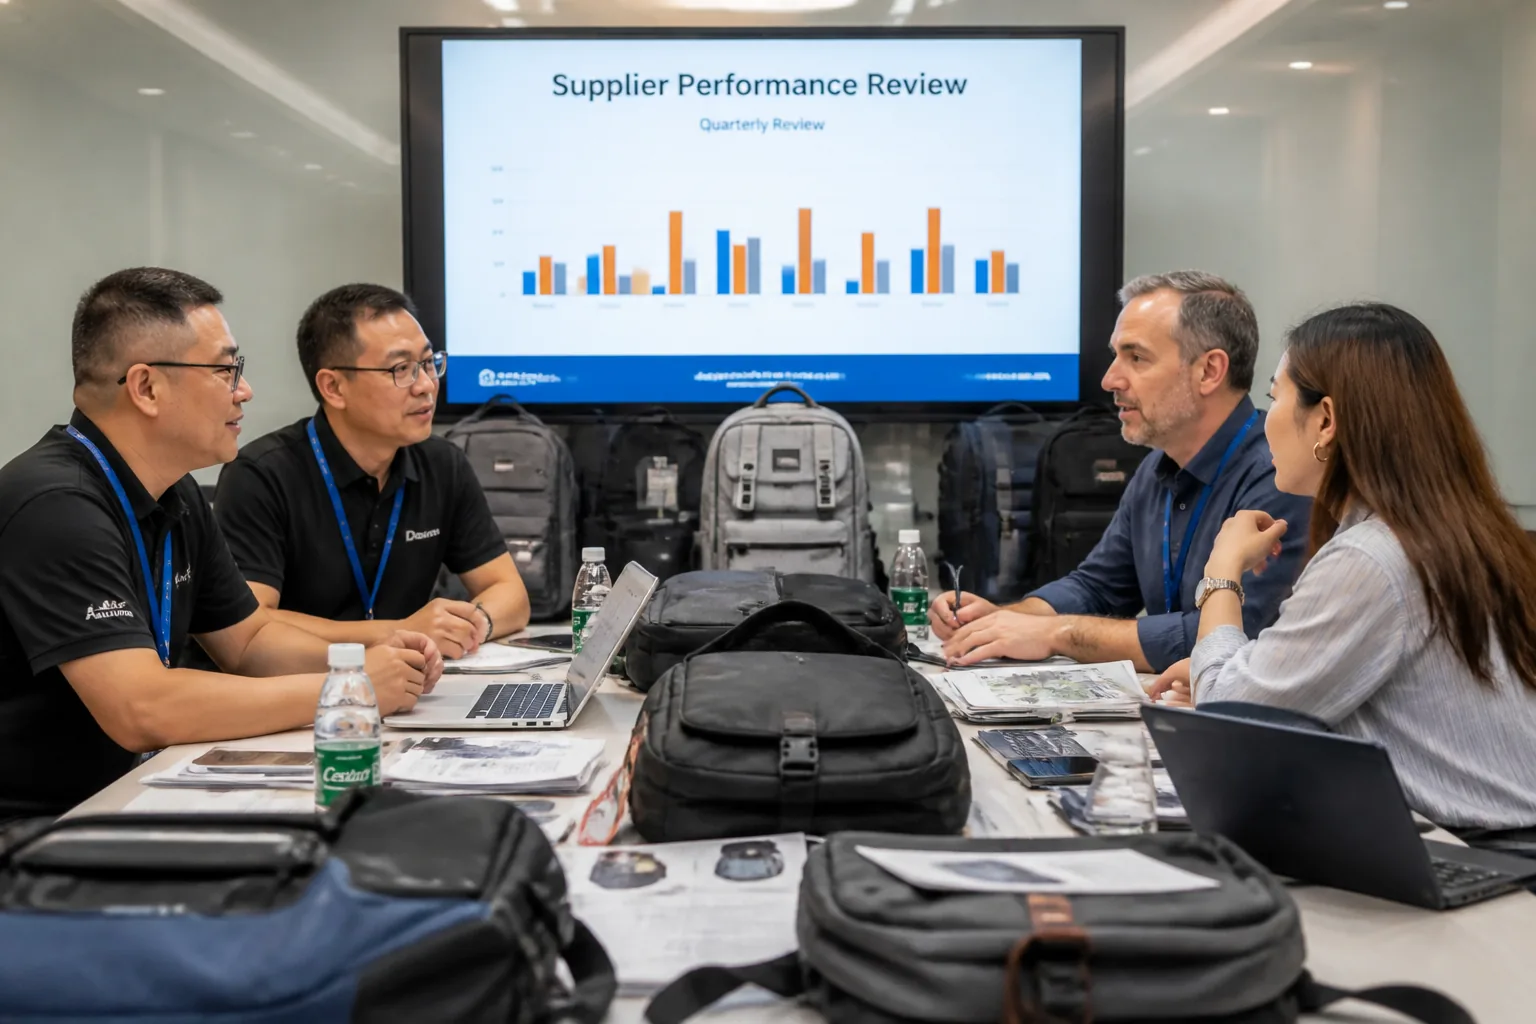
Buyer and factory management discussing a performance review
The Development Levers
Lever
Typical improvement
Process training
Skill consistency
Standard work documentation
Fewer method variations
Quality standard alignment
Fewer disputes
Equipment investment guidance
Capacity and precision
Layout and flow advice
Efficiency
Material specification clarity
Fewer substitutions
Quality system support
Fewer escapes
The Development Plan Structure
Element
Content
Finding
What the audit identified
Root cause
Why it exists
Action
What changes
Owner
Who is responsible
Deadline
When it is complete
Verification
How it is checked
Evidence
What proves closure
The Improvement Priorities
Priority
Focus
1
Critical and major findings
2
Quality escapes at the source
3
Documentation and traceability
4
Capacity and lead time
5
Efficiency and cost
6
Long-term capability building
The Support Options
Option
Cost
Effect
Written feedback
Low
Awareness
On-site coaching
Moderate
Method change
Joint improvement project
Moderate
Sustained gain
Third-party training
Moderate
Skill building
Investment sharing
High
Capacity or equipment
The Development Timeline Table
Phase
Duration
Milestone
Feedback
1 week
Report shared
Plan agreement
2 weeks
Actions accepted
Implementation
30–90 days
Changes made
Verification
Next audit
Findings closed
Sustained review
6 months
No recurrence
The Recognition Levers
Lever
Effect
Preferred supplier status
Priority in allocation
Increased order share
Growth incentive
Longer forecast visibility
Better planning
Reduced inspection level
Lower cost for both
Joint development projects
Capability building
Public acknowledgement
Motivation
The Exit Criteria
Condition
Action
Repeated critical findings
Suspend new orders
Failed corrective plan
Formal warning
Continued non-performance
Phase out
Compliance violation
Immediate stop
Recovery demonstrated
Conditional reinstatement
Qualifying a New Backpack Supplier
Approval should follow a defined path with defined evidence. Skipping steps transfers risk to production.
The Qualification Stages
Stage
Output
Sourcing search
Long list
Desk screening
Shortlist
Questionnaire
Comparable data
Sample request
Capability evidence
Factory audit
Verified claims
Trial order
System test
Approval
Approved supplier list
The Questionnaire Contents
Section
Items
Company
Legal name, ownership, year founded
Facilities
Location, area, buildings
Equipment
Machine list with counts
Capacity
Monthly output by product type
Staffing
Headcount by function
Quality
System description, staff
Compliance
Certificates and status
Export experience
Markets, customers
Financial
Payment terms, bank reference
The Trial Order Design
Element
Purpose
Moderate volume
Realistic without exposure
Representative style
Tests the intended product
Full packaging
Tests the whole chain
Normal delivery terms
Real lead time
Standard inspection
AQL verification
Documented issues
Learning record
The Sample Evaluation Table
Criterion
Check
Specification match
Dimensions, materials
Workmanship
Stitching, edges, cleanliness
Hardware
Type, function, finish
Function
Zippers, straps, load test
Packaging
Protection, marking
Documentation
Spec pack accuracy
The Approval Criteria
Requirement
Evidence
Capability confirmed
Samples approved
Quality system verified
Audit score
Capacity adequate
Capacity verification
Compliance clean
Valid certificate and report
Commercial terms agreed
Signed agreement
Trial order passed
Inspection result
The Approved Supplier List
Field
Maintained
Legal entity
Name and number
Audit date and score
Current
Certificate status
Expiry tracked
Approved product scope
What they may quote
Performance tier
Based on scorecard
Capacity allocation
Share of business
The Re-Approval Triggers
Trigger
Action
Certificate expires
Suspend until renewed
Audit score falls below threshold
Corrective plan
Ownership changes
Re-evaluate
Facility relocation
Full re-audit
Major quality failure
Full re-evaluation
The Risk Distribution Principle
Principle
Practice
No single source for critical styles
Dual sourcing
Capacity not more than 40% of one supplier
Balance
Different regions for risk
Geographic spread
Backup supplier qualified in advance
Ready to switch
Managing the Supplier Relationship
Evaluation and auditing are inputs. The relationship converts them into reliable supply.
The Governance Rhythm
Frequency
Activity
Weekly
Production and shipment status
Monthly
Scorecard metrics
Quarterly
Performance review meeting
Annually
Strategic review and planning
The Meeting Agenda Table
Agenda item
Purpose
Scorecard review
Shared performance view
Quality trends
Focus improvement
Delivery performance
Schedule discipline
Capacity outlook
Planning alignment
Development actions
Close findings
Commercial items
Cost and terms
New programs
Early involvement
The Communication Standards
Standard
Reason
Single point of contact per side
Avoids confusion
Written confirmation of changes
Prevents disputes
Defined response window
Maintains speed
Escalation path documented
Resolves issues
Shared specification repository
Version control
The Cost Conversation
Topic
Approach
Price benchmarking
Compare like with like
Cost breakdown
Understand the drivers
Volume commitment
Trade certainty for price
Payment terms
Negotiate alongside price
Cost reduction plan
Joint annual target
Hidden costs
Track tooling, sampling, freight
The Total Cost View
Cost element
Often overlooked
Unit price
Visible
Tooling and development
Upfront
Sampling rounds
Repeated cost
Inspection and testing
Per lot
Freight and duties
Per shipment
Claims and returns
Post-sale
Inventory carrying
Overordering
Management time
Communication load
The Negotiation Principles
Principle
Reason
Negotiate before the season
Capacity is scarce in season
Bundle volume across styles
Increases leverage
Offer forecast visibility
Factory can plan
Keep pricing transparent
Reduces surprises
Never negotiate only on price
Value includes reliability
Respect a sustainable margin
Suppliers need to survive
The Sustainability Check
Practice
Evaluation
Factory margin health
Able to invest
Order stability
Allows planning
Payment timeliness
Affects cash flow
Long-term intent
Builds capability
The Partnership Indicators
Indicator
Meaning
Early problem disclosure
Trust
Proactive cost proposals
Engagement
Capacity reserved for you
Strategic value
Improvement without prompting
Ownership
Long tenure
Mutual benefit
Factory note: Suppliers treat buyers the way they are treated. Brands that provide stable forecasts, pay on time, keep specifications stable, and give credit for good performance receive capacity priority during tight seasons — which is worth more than the last percentage point of unit price.
Common Audit and Scorecard Mistakes
Programs fail for predictable reasons. Most are process design errors rather than bad intentions.
The Mistake Table
Mistake
Consequence
Auditing once, never again
Deterioration goes unseen
Scoring without data
Opinion as measurement
Ignoring the floor
Documents hide reality
No worker interviews
Social risks missed
No capacity verification
Late delivery surprise
Certificates accepted at face value
Compliance exposure
No corrective action follow-up
Findings repeat
Scorecard never shared
No development
One supplier for everything
Concentration risk
Selecting on price alone
Total cost rises
The Anti-Pattern Table
Anti-pattern
Better practice
Audit as inspection event
Audit as baseline
Pass or fail thinking
Improvement pathway
Punitive scoring
Joint development
Long checklist, no priorities
Focused critical items
Annual only
Quarterly review
Internal only
Third-party verification
Paper compliance
Verified practice
The Findings That Predict Failure
Finding
Predictive value
No incoming material inspection
High
No corrective action history
High
Records created on request
High
Machine count mismatch
High
Excessive recorded overtime
High
No calibration records
Moderate
No training records
Moderate
No traceability system
Moderate
The Minimum Viable Program
Element
Minimum standard
Desk screening
Before any sample order
Questionnaire
Standardised, comparable
Sample evaluation
Documented criteria
Audit
Before approval and annually
Scorecard
Quarterly with weighted categories
Corrective actions
Tracked to closure
Dual sourcing
Critical styles
Document verification
Certificates confirmed
The Buyer’s Evaluation Checklist
A practical checklist covering the evaluation cycle from search to ongoing management.
Stage One: Screening
Item
Done
Product category match confirmed
☐
Export experience in target market
☐
Business licence verified
☐
Basic certificates checked
☐
References requested
☐
Questionnaire returned and complete
☐
Stage Two: Verification
Item
Done
Sample requested with spec pack
☐
Sample evaluated against criteria
☐
Factory audit scheduled
☐
Capacity verified against machines
☐
Quality system reviewed
☐
Worker interviews conducted
☐
Certificate numbers verified with issuers
☐
Stage Three: Approval
Item
Done
Audit score meets threshold
☐
Corrective actions agreed
☐
Trial order placed
☐
Trial order inspected
☐
Commercial terms signed
☐
Added to the approved supplier list
☐
Stage Four: Ongoing Management
Item
Done
Scorecard completed quarterly
☐
Scorecard shared with the supplier
☐
Improvement targets agreed
☐
Certificates monitored for expiry
☐
Annual audit scheduled
☐
Dual sourcing in place
☐
Capacity allocation reviewed
☐
The Nine Evaluation Rules
Rule
Reason
Verify, do not assume
Claims are not evidence
Watch the floor, not the meeting room
Reality shows in operations
Weight by business priority
Not all categories matter equally
Share the score
Development needs feedback
Follow up corrective actions
Otherwise nothing changes
Re-audit on a schedule
Systems drift
Never single-source critical styles
Concentration risk
Price is one factor, not the factor
Total cost decides
Document every decision
Protects both parties
FAQ
How often should backpack suppliers be audited?
Audit before approval and annually thereafter for core suppliers. Suppliers with a poor score or significant findings should be audited more frequently, typically every 6 months, and audited again within 60 to 90 days to verify that corrective actions have actually been implemented.
What categories should a supplier scorecard include?
The most practical weighting for backpack sourcing is quality 25%, delivery 20%, cost 15%, capacity and lead time 15%, compliance 15%, and communication 10%. The weights should change with the business model, for example raising delivery weight for fast fashion cycles and compliance weight for regulated markets.
What is the difference between a factory audit and an inspection?
An inspection checks finished product against a quality standard, usually using AQL sampling. An audit examines the system that produces the product, covering machinery, process control, documentation, staffing, compliance, and capacity. A factory can pass an inspection and still fail an audit, because the audit looks at whether the process can produce consistent quality.
Should factory audits be announced or unannounced?
Use announced audits for the first visit so the factory can prepare documents and arrange staff, then introduce semi-announced or unannounced follow-ups. Unannounced visits reveal the real condition of the floor, which is why they are standard practice for social compliance verification.
How do I verify a factory’s capacity claim?
Count the machines on the floor, confirm working hours and shifts, estimate line efficiency from observation, and calculate realistic monthly output. Then compare that figure with the claimed capacity and with shipping records. If the claim exceeds the physical calculation, either subcontracting is involved or the numbers are inflated.
What documents should I request from a new backpack supplier?
Business licence, valid certifications with verifiable numbers, the most recent audit report, quality system documentation, inspection records, training records, machinery list, capacity calculation, and material traceability documents. Certificates alone are insufficient — the audit report behind them is what confirms the system.
How many suppliers should a brand work with?
Qualification depends on volume, but the operating rule is to avoid single-sourcing any critical style. A practical model is one primary and one qualified backup per product family, with no single supplier carrying more than around 40% of total volume.
What are the most reliable early warning signs of a problematic supplier?
No incoming material inspection, no corrective action history, control records that appear only when requested, a machine count that does not match the audit claim, and excessive recorded working hours. These findings predict delivery and quality failure more reliably than any single audit score.
Conclusion
Supplier evaluation works when it is systematic rather than instinctive. A scorecard converts performance into comparable numbers; an audit verifies what documents cannot; a development process turns findings into capability.
For buyers, the sequence is clear. Screen on facts before requesting samples. Verify capacity by counting machines and calculating output rather than accepting a figure. Audit before approval, then re-audit on a schedule.
Weight the scorecard to the business model, and share the result with the supplier — a measurement nobody sees cannot improve anything. Track corrective actions to closure, verify certificate numbers with the issuing bodies, and never let a single supplier carry a critical style.
For factories, the same program is an opportunity. A plant that documents its processes, maintains its records, audits its own performance, and closes findings promptly wins preferred status, larger allocation, and reduced inspection levels. In a market where capacity is scarce in season, those advantages are worth more than a marginally lower unit price — for both sides of the relationship.