Factory Sustainability Reporting and Carbon Footprint
Factory Sustainability Reporting and Carbon Footprint
Sustainability reporting has moved from a marketing exercise to a procurement requirement. Brands now ask their bag factories for energy data, emission figures, and documented improvement plans before placing orders, and the factories that can answer those questions with numbers win programs that others never see.
The difficulty is that most factories already collect the underlying data without realising it. Electricity bills, material purchase records, and production volumes contain nearly everything required to build a credible carbon footprint for an order.
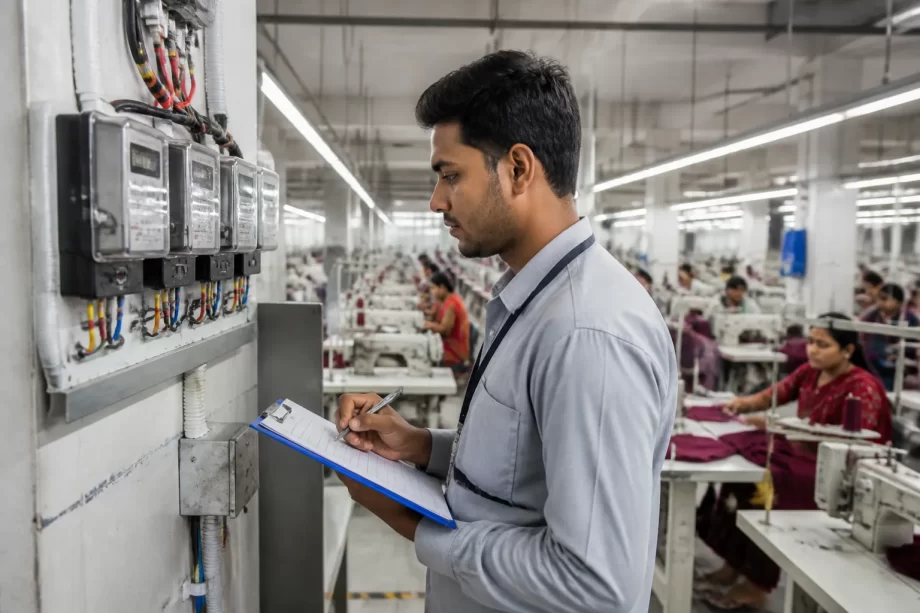
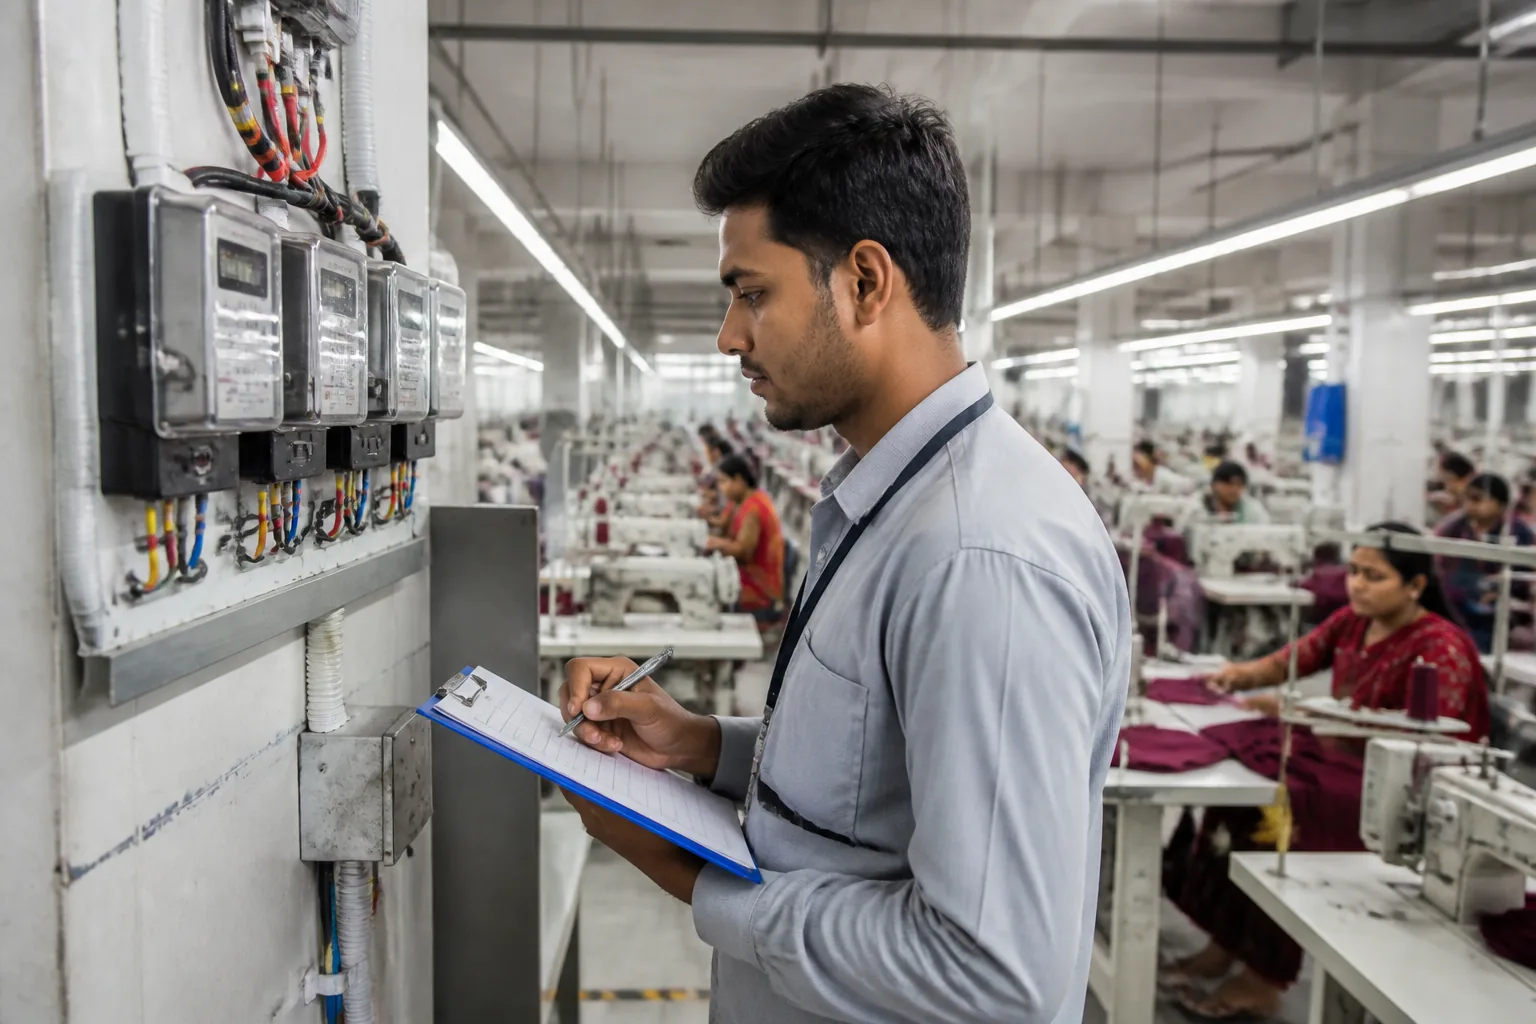
Technician recording electricity meter readings on a production floor
This guide covers sustainability reporting and carbon footprinting from a bag manufacturer’s perspective: what brands actually request, how emissions are calculated and categorised, how factory data is collected and verified, how a report is assembled, and where the realistic reduction opportunities sit in a backpack factory.
Why Sustainability Reporting Became a Procurement Requirement
Buyers now evaluate factories on environmental performance alongside quality, cost, and delivery. The shift is driven by regulation, by corporate reporting obligations, and by consumer expectations that reach the factory through the brand.
The Drivers
Driver
Effect on the factory
Brand reporting obligations
Factory data feeds brand disclosures
Regulation on products
Documentation required at shipment
Retailer requirements
Supplier questionnaires
Investor pressure
Supply chain transparency
Consumer expectations
Claims must be substantiated
Cost pressure
Energy and waste efficiency
The Buyer Request Types
Request
Typical content
Supplier questionnaire
Policy, data, and targets
Carbon footprint per order
Emission figure for the product
Energy data
Consumption and sources
Waste data
Volume and disposal route
Water data
Consumption and treatment
Certification evidence
Audit or certificate
Improvement plan
Targets and actions
The Maturity Levels Table
Level
Characteristics
Reactive
Answers questionnaires on request
Systematic
Regular data collection
Measured
Verified footprint calculations
Managed
Targets with tracked progress
Leading
Design-stage collaboration with buyers
The Business Value Table
Value
Mechanism
Preferred supplier status
Meets buyer requirements
Price stability
Efficiency offsets cost
Reduced energy cost
Measured consumption
Reduced waste cost
Material recovery
New program access
Capability to serve reporting brands
Risk reduction
Compliance headroom
The Reporting Burdens Table
Burden
Mitigation
Multiple buyer formats
One core data set, many extracts
Inconsistent definitions
Documented methodology
Manual data collection
Meter-level recording
Verification requests
Retained evidence
Changing requirements
Annual methodology review
The Common Objections Table
Objection
Response
Too small to report
Data requirements scale with order size
No staff for it
Existing roles, defined responsibilities
Data not available
Most data already exists
Cost too high
Measurement reduces energy cost
Buyer will not check
Verification requests are increasing
Factory note: A factory that can produce a documented emission figure per order, with the source data retained and the method stated, answers a question most competitors cannot answer at all. That capability frequently decides which plant is shortlisted for a program, long before price is discussed.
Carbon Footprint Fundamentals
A carbon footprint is an emission quantity expressed in a common unit. For factories, the practical unit is kilograms of carbon dioxide equivalent per unit produced.
The Core Concepts
Term
Meaning
Carbon dioxide equivalent
Unit combining greenhouse gases
Activity data
Measured quantity of an activity
Emission factor
Emissions per unit of activity
Scope
Category of emission source
Boundary
What is included
Allocation
Splitting emissions between products
The Unit Table
Gas
Global warming potential
Carbon dioxide
1
Methane
Approximately 28
Nitrous oxide
Approximately 265
Refrigerant gases
Hundreds to thousands
The Activity Data Table
Activity
Data required
Electricity
Kilowatt hours consumed
Fuel
Litres or kilograms burned
Gas
Cubic metres consumed
Transport
Tonne-kilometres
Materials
Kilograms purchased
Waste
Kilograms disposed
The Emission Factor Table
Source
Factor type
Grid electricity
Regional grid average
Natural gas
Per cubic metre
Diesel
Per litre
Freight road
Per tonne-kilometre
Sea freight
Per tonne-kilometre
Fabric production
Per kilogram of material
The Calculation Table
Step
Action
1
Define the boundary
2
Collect activity data
3
Apply emission factors
4
Sum by scope
5
Allocate to products
6
Document assumptions
The Unit Denominator Table
Denominator
Use
Per unit produced
Product comparison
Per kilogram of material
Material comparison
Per order
Buyer reporting
Per unit of revenue
Financial reporting
Per machine hour
Process benchmarking
The Accuracy Table
Level
Data quality
Metered
Highest
Invoiced
High
Estimated from volume
Moderate
Modelled from averages
Lowest
The Documentation Table
Element
Content
Boundary statement
What is included
Method statement
How it was calculated
Source records
Meters, invoices, records
Factor sources
Where factors came from
Assumptions
Stated explicitly
Reviewer
Who checked it
Defining the Boundary and Scopes
The boundary decision determines what the footprint includes, and therefore what the number means. Boundaries must be stated or the figure cannot be compared.
The Scope Definitions
Scope
Content
Scope 1
Direct emissions from owned sources
Scope 2
Purchased electricity and heat
Scope 3
Upstream and downstream value chain
The Factory Scope Table
Scope
Factory examples
Scope 1
Boiler fuel, generator diesel, vehicles
Scope 2
Purchased electricity
Scope 3 upstream
Purchased materials, inbound freight
Scope 3 downstream
Outbound freight, product disposal
The Boundary Options Table
Boundary
Inclusion
Gate to gate
Factory operations only
Cradle to gate
Materials plus factory
Cradle to grave
Full product life
Order specific
Allocated share of a period
Facility annual
Whole site
The Boundary Decision Table
Buyer request
Appropriate boundary
Factory assessment
Gate to gate or facility annual
Product comparison
Cradle to gate
Brand product disclosure
Cradle to gate
Full life cycle claim
Cradle to grave
Order-level reporting
Allocated cradle to gate
The Inclusion Table
Element
Usually included
Direct fuel combustion
Yes
Purchased electricity
Yes
Purchased materials
Per boundary
Inbound freight
Per boundary
Outbound freight
Per boundary
Employee commuting
Often excluded
Capital equipment
Usually excluded
The Exclusion Table
Exclusion
Reason to state it
Commuting
Data unavailable
Capital goods
Amortisation complexity
Packaging
May be included separately
Sample production
Low volume
Office operations
Separated by site
The Allocation Methods Table
Method
Basis
Mass
Per kilogram of output
Volume
Units produced
Labour hours
Time-based
Machine hours
Equipment-based
Revenue
Financial allocation
The Allocation Choice Table
Situation
Preferred method
Similar products
Unit allocation
Mixed material intensity
Mass allocation
Mixed labour intensity
Labour hour allocation
Sample and bulk mix
Unit plus mass blend
The Comparability Table
Factor
Effect on comparability
Boundary difference
Figures not comparable
Allocation difference
Figures not comparable
Factor vintage
Minor difference
Data quality
Moderate difference
Method transparency
Enables adjustment
Factory note: Two factories can report different footprints for an identical backpack without either being wrong, because one measured gate to gate and the other cradle to gate. Stating the boundary and the allocation method alongside the number is what makes the figure meaningful, and it protects the factory when a buyer compares suppliers.
Collecting Factory Data
Credible reporting rests on routine data collection. The goal is a monthly record that can be summed, not a scramble before an audit.
Environmental engineer reviewing emission data in a factory office
The Data Categories
Category
Source
Electricity
Utility meter and submeters
Fuel
Purchase records and tank readings
Gas
Utility meter
Water
Utility meter
Materials
Purchase records
Waste
Disposal records and weighbridge
Production
Production reports
Freight
Shipping documents
The Metering Table
Meter level
Purpose
Main incoming
Total consumption
Sub-meter by workshop
Area accountability
Sub-meter by process
Process benchmarking
Sub-meter by large machine
Equipment analysis
Portable meter
Temporary investigation
The Data Frequency Table
Data type
Frequency
Electricity and gas
Monthly, ideally weekly
Water
Monthly
Fuel
Per delivery
Materials
Per purchase order
Production volume
Daily
Waste
Per shipment
The Record Structure Table
Field
Content
Period
Month or week
Site
Facility identifier
Meter reference
Which meter
Reading
Value and unit
Source document
Invoice or log
Recorder
Who entered it
Review
Who checked it
The Responsibility Table
Role
Responsibility
Production manager
Production volume data
Maintenance
Meter readings
Purchasing
Material and fuel records
Finance
Invoice verification
Sustainability coordinator
Consolidation and reporting
General manager
Review and sign-off
The Data Quality Table
Issue
Control
Estimated readings
Flag and replace when invoiced
Missing month
State the gap explicitly
Meter fault
Document and estimate conservatively
Unit error
Standardise units at entry
Duplicate entry
Reconciliation against invoices
The Digital Tools Table
Tool
Use
Spreadsheet template
Small factories
Energy monitoring system
Sub-metering at scale
Enterprise resource planning module
Integration with production
Utility portal data
Verified consumption
The Traceability Table
Requirement
Practice
Source documents retained
Invoices and logs filed by period
Calculation recorded
Formula visible in the workbook
Factors cited
Source and year noted
Revisions tracked
Version history maintained
Review evidenced
Signed check record
Emission Sources in a Backpack Factory
Emissions in a bag factory are concentrated in a small number of categories, and materials dominate most footprints.
The Source Breakdown
Source
Typical share
Purchased materials
Largest
Purchased electricity
Significant
Inbound freight
Moderate
Outbound freight
Moderate
Direct fuel use
Smaller
Waste and scrap
Smaller
The Process Energy Table
Process
Energy character
Cutting
Motor-driven, moderate
Sewing
Many small motors, cumulative
Heat pressing and welding
High peak demand
Fusing and lamination
High thermal demand
Lighting and ventilation
Continuous base load
Compressed air
Inefficiency-prone
The Material Intensity Table
Material
Relative intensity
Virgin synthetic fabric
High
Recycled synthetic fabric
Lower
Natural fibre fabric
Variable
Leather
High
Foam
Moderate to high
Metal hardware
High per kilogram
The Emission Driver Table
Driver
Influence
Product weight
Material quantity
Material type
Emission factor
Panel count
Cutting waste
Rejection rate
Wasted material and labour
Order volume
Allocation base
Factory efficiency
Energy per unit
The Waste Source Table
Waste type
Source
Cutting offcuts
Pattern and nesting
Fabric defects
Material quality
Rejected units
Production quality
Packaging waste
Inbound and outbound
Off-spec material
Supplier quality
The Order Footprint Table
Component
Basis
Material emissions
Mass consumed times factor
Electricity emissions
Allocated consumption
Fuel emissions
Allocated consumption
Freight emissions
Mass times distance
Waste emissions
Mass disposed times factor
The Intensity Benchmark Table
Measure
Use
Emissions per unit
Product comparison
Emissions per kilogram
Material efficiency
Energy per unit
Process efficiency
Waste percentage
Material efficiency
Emissions per order value
Commercial framing
Reduction Opportunities
Reduction work should follow the data. In most bag factories the largest achievable reductions come from materials and energy efficiency rather than from capital projects.
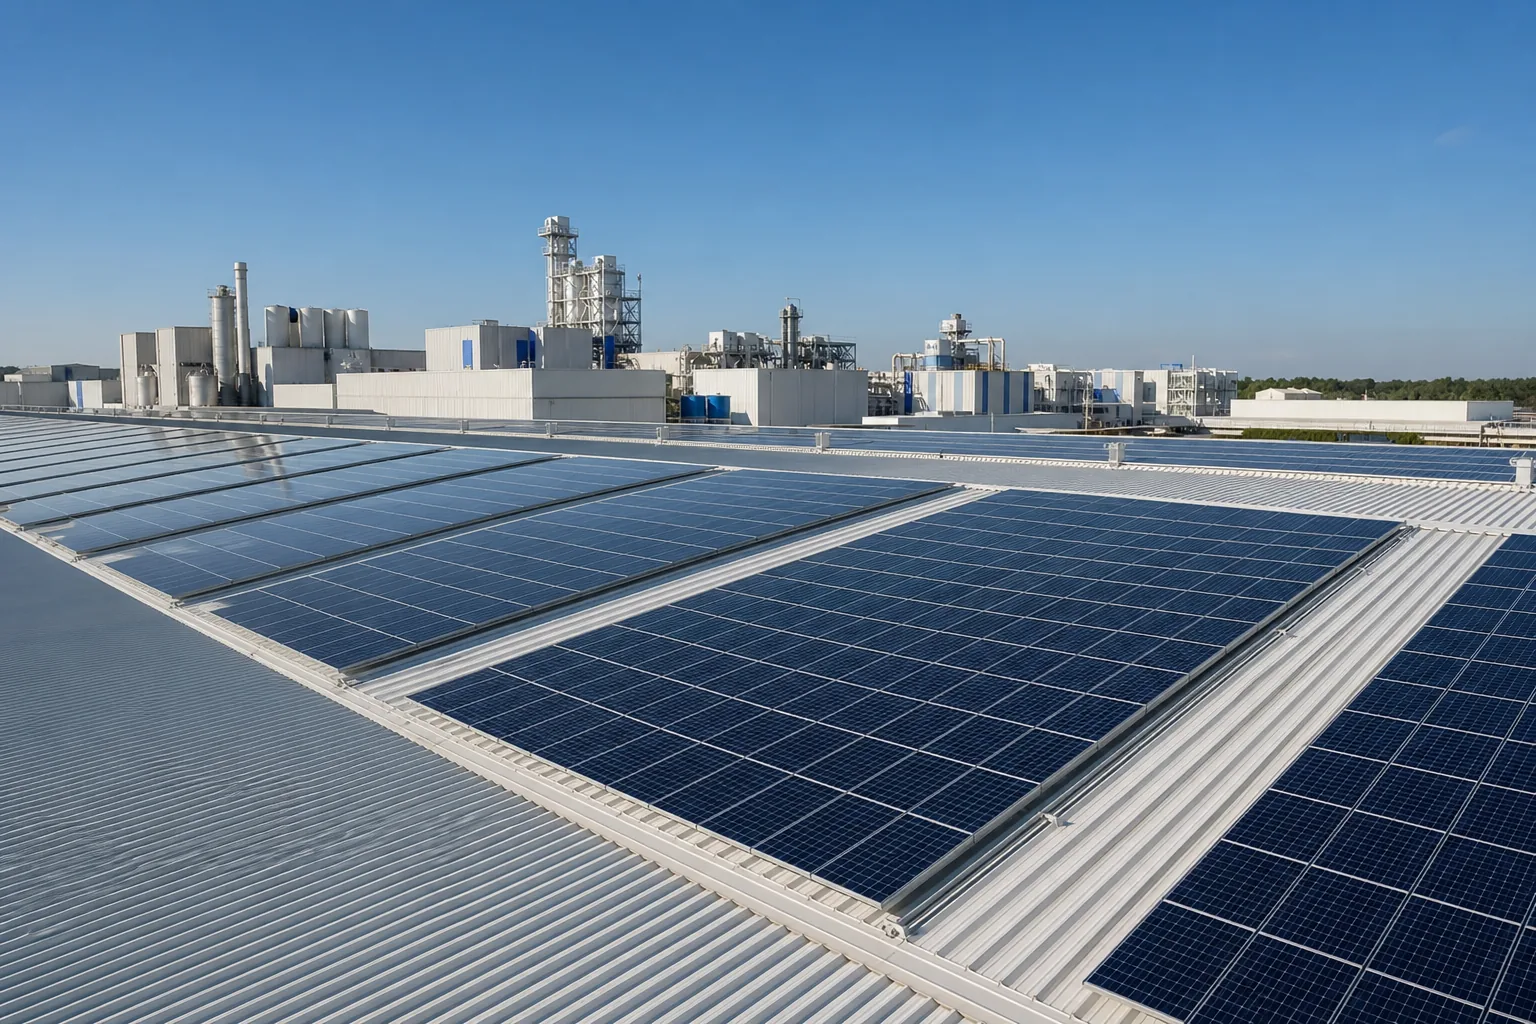
Solar panels installed on an industrial factory rooftop
The Reduction Hierarchy
Priority
Action type
1
Measure and manage consumption
2
Eliminate waste and rework
3
Improve process efficiency
4
Recover and recycle material
5
Substitute lower-emission materials
6
Install renewable generation
The Quick Wins Table
Action
Investment
Switch off idle machines
None
Compressed air leak repair
Low
Lighting upgrade to LED
Low
Maintenance of heat equipment
Low
Cutting room nesting improvement
Low
Waste segregation at source
Low
The Efficiency Table
Area
Measure
Compressed air
Leak survey and pressure optimisation
Heat processes
Insulation and scheduling
Motors
Efficient replacements on failure
Lighting
Sensors and LED
Ventilation
Variable speed control
Maintenance
Planned rather than reactive
The Material Table
Action
Effect
Improved nesting
Less cutting waste
Lower rejection rate
Less wasted material
Recycled content adoption
Lower emission factor
Material substitution
Factor reduction
Offcut recovery
Waste diversion
The Waste Table
Action
Effect
Source segregation
Higher recovery value
Offcut reuse in small components
Material saving
Supplier take-back of packaging
Diversion
Rework rather than scrap
Cost and emissions
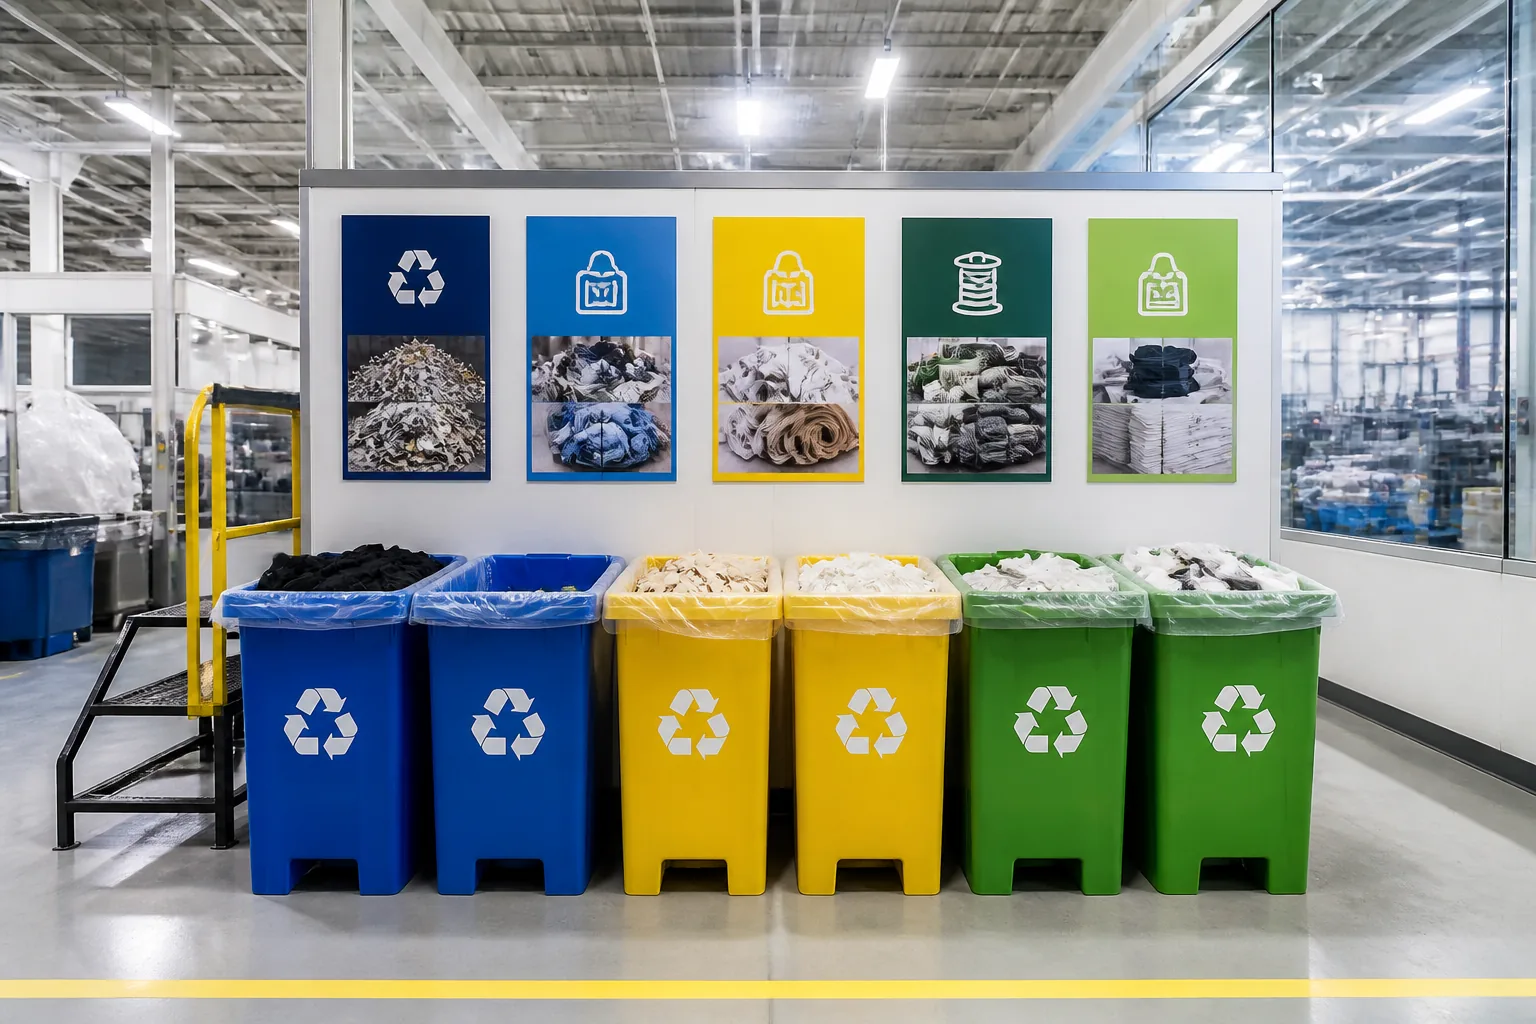
Waste segregation and recycling station in a bag factory
The Renewable Table
Option
Consideration
Rooftop solar
Site suitability and load profile
Green tariff purchase
Market availability
Power purchase agreement
Contract length
Battery storage
Cost and peak shaving
The Target Setting Table
Target type
Example framing
Intensity target
Emissions per unit produced
Absolute target
Total site emissions
Efficiency target
Energy per unit
Waste target
Waste percentage of material
Renewable target
Share of consumption
The Implementation Table
Phase
Activity
Baseline
Establish measured consumption
Quick wins
No or low cost actions
Efficiency
Process and equipment
Materials
Specification and sourcing
Generation
Renewable investment
Review
Annual reassessment
Factory note: The emission reductions a factory can demonstrate most convincingly are the ones already inside its own operations: less cutting waste, fewer rejected units, less idle machine time, and repaired compressed air leaks. These require measurement rather than capital, and they reduce cost at the same time as emissions, which makes them sustainable in the commercial sense as well.
Assembling the Report
A sustainability report is a structured document that states what was measured, how, and what it means. Length matters less than consistency and traceability.
The Report Sections
Section
Content
Scope and boundary
What is included
Methodology
How figures were calculated
Data summary
Consumption and emissions
Intensity metrics
Per unit and per kilogram
Improvement actions
What was done
Targets
What is planned
Evidence
Source documents
Statement
Management sign-off
The Data Summary Table
Indicator
Unit
Electricity consumption
Kilowatt hours
Fuel consumption
Litres or cubic metres
Water consumption
Cubic metres
Greenhouse gas emissions
Kilograms of carbon dioxide equivalent
Emissions per unit
Kilograms per unit
Waste generated
Kilograms
Waste recovery rate
Percentage
The Intensity Table
Metric
Denominator
Emission intensity
Per unit produced
Emission intensity
Per kilogram of output
Energy intensity
Per unit produced
Water intensity
Per unit produced
Waste intensity
Percentage of material input
The Action Report Table
Field
Content
Action
What was implemented
Period
When
Investment
Cost
Effect
Measured change
Verification
How it was confirmed
The Target Table
Field
Content
Target
What will change
Baseline
Starting figure
Year
Target year
Metric
How it is measured
Responsibility
Who owns it
The Evidence Pack Table
Document
Purpose
Utility invoices
Consumption verification
Meter logs
Reading records
Calculation workbook
Method transparency
Disposal receipts
Waste verification
Purchase records
Material quantities
Certification documents
Third-party evidence
The Report Formats Table
Format
Use
Narrative report
Brand review
Data annex
Buyer data request
Questionnaire response
Retailer portal
Certificate summary
Public communication
The Language and Consistency Table
Element
Practice
Units
Stated once and used consistently
Terminology
Defined in a glossary
Periods
Aligned to the calendar
Rounding
Consistent convention
Translation
Reviewed before release
Verification and Audit
Verification is what separates a claim from a substantiated figure. Preparing for it is a matter of record keeping rather than extra work.
The Verification Types
Type
Character
Internal review
Self-check against the method
Second-party review
Customer assessment
Third-party verification
Independent assurance
Certification audit
Standard conformity
Buyer audit
Site inspection
The Verification Preparation Table
Preparation
Purpose
Documented methodology
Reproducible calculation
Source document file
Evidence trail
Calculation workbook
Transparent formulas
Boundary statement
Defined scope
Assumptions list
Stated limitations
Named responsible person
Point of contact
The Common Findings Table
Finding
Cause
Boundary not stated
Method gap
Activity data unsupported
Missing source documents
Factor source not cited
Documentation gap
Estimated data used without flagging
Disclosure gap
Inconsistent units
Control gap
Allocation method unclear
Method gap
The Evidence Trail Table
Stage
Record
Meter reading
Log and photograph
Utility invoice
Filed by period
Data entry
Workbook entry
Calculation
Formula and factor
Report
Published figure
Review
Check record
The Certification Table
Scheme type
Focus
Quality management
Process consistency
Environmental management
Environmental system
Energy management
Energy performance
Recycled content
Material verification
Social compliance
Labour conditions
The Audit Readiness Table
Item
Ready
Current methodology documented
☐
Twelve months of data available
☐
Source documents filed
☐
Responsible person named
☐
Prior findings closed
☐
Improvement evidence available
☐
The Continuous Improvement Table
Review point
Activity
Monthly
Data completeness check
Quarterly
Intensity trend review
Annually
Methodology review
On regulation change
Requirement update
On buyer request
Data extract
Working with Buyers on Sustainability
Sustainability performance is now a buyer relationship, not a compliance event. How the data is communicated determines how much value the factory extracts from it.
The Buyer Conversation Table
Topic
Factory position
Data availability
State what is measured and how
Boundary
State clearly and consistently
Improvement
Show measured progress
Limitations
Disclose honestly
Joint action
Propose material or design changes
The Information Request Workflow
Step
Action
1
Receive the request and clarify the boundary
2
Extract data from the maintained records
3
Verify against source documents
4
Prepare the response in the requested format
5
Retain a copy and the underlying evidence
6
Review recurring requests for template use
The Frequent Request Table
Request
Response basis
Emission per unit
Allocated cradle to gate
Energy consumption
Metered totals
Renewable share
Tariff and generation records
Waste recovery rate
Disposal records
Material certification
Supplier certificates
Improvement plan
Documented targets and actions
The Joint Improvement Table
Opportunity
Requirement
Lower-impact material
Buyer specification change
Reduced panel count
Design collaboration
Higher recycled content
Specification and testing
Better nesting
Joint development
Consolidated shipping
Logistics coordination
The Communication Table
Audience
Emphasis
Brand sustainability team
Method and data quality
Brand sourcing team
Consistency and capability
Retailer
Standard questionnaire responses
End consumer
Verified and specific claims only
The Claim Discipline Table
Claim
Requirement
Recycled content
Verified proportion
Emission reduction
Measured against a baseline
Renewable energy
Documented source
Carbon neutral
Avoid unless fully substantiated
Eco-friendly
Avoid as a vague term
Factory note: The most valuable sustainability conversations with buyers are the ones about materials and design, not about questionnaires. A factory that can show which material specification change would cut the order footprint by a measurable amount, and at what cost, moves the discussion from compliance to product development, where it has far more influence.
Common Reporting Mistakes
Most reporting problems are methodological rather than numerical. The figures may be derived correctly and still be unusable because the context is missing.
The Frequent Mistakes
Mistake
Consequence
Boundary not stated
Figure cannot be compared
Estimated data presented as measured
Credibility risk
Inconsistent allocation
Year-on-year drift
Units mixed
Calculation errors
Factor source not cited
Unverifiable result
Scope 3 omitted without explanation
Incomplete picture
Improvement claimed without a baseline
Unsubstantiated
Data collected only before an audit
Gaps and uncertainty
The Data Integrity Table
Risk
Control
Manual transcription error
Double entry and reconciliation
Missing period
Documented gap statement
Meter change
Recorded meter replacement
Site expansion
Baseline restatement
Unit conversion error
Standard conversion table
Version confusion
Version-controlled workbook
The Claim Risk Table
Weak claim
Better approach
Carbon neutral product
State the measured figure and the boundary
Green factory
Cite efficiency improvements against a baseline
Zero waste
State the recovery rate and the disposal route
Sustainable material
State the verified recycled content
The Governance Table
Element
Practice
Named owner
Single accountable person
Documented method
Written procedure
Annual review
Methodology reassessment
Management review
Signed report
Record retention
Defined period
The Sustainability Reporting Checklist
Foundation
Item
Done
Boundary defined and documented
☐
Methodology written down
☐
Emission factors sourced and recorded
☐
Allocation method chosen and stated
☐
Responsible person named
☐
Data collection routine established
☐
Data
Item
Done
Electricity metered monthly
☐
Fuel consumption recorded per delivery
☐
Water consumption metered
☐
Material purchases recorded by weight
☐
Waste quantities recorded
☐
Production volume recorded
☐
All records filed with source documents
☐
Calculation
Item
Done
Activity data summed by period
☐
Factors applied consistently
☐
Scopes separated
☐
Emissions allocated to products
☐
Intensity metrics calculated
☐
Assumptions listed
☐
Reporting
Item
Done
Boundary and method stated in the report
☐
Data annex prepared for buyers
☐
Improvement actions described with results
☐
Targets set with a baseline
☐
Evidence pack assembled
☐
Management sign-off obtained
☐
The Six Rules
Rule
Reason
Measure before claiming
Unmeasured claims cannot be defended
State the boundary with every figure
Comparability
Keep the source documents
Verification depends on them
Use consistent units and periods
Trend accuracy
Separate measured from estimated data
Credibility
Review the method annually
Requirements change
Cost and Resource Implications
Sustainability reporting requires modest resources if it is built on routines rather than on projects.
The Resource Table
Requirement
Scale
Staff time
Part of an existing role
Metering equipment
Sub-meters where justified
Software
Spreadsheet or monitoring system
External verification
Optional and periodic
Certification
Optional and market-dependent
The Cost-Benefit Table
Area
Character
Metering
One-off cost, ongoing benefit
Data management
Staff time
Verification
Periodic cost
Energy efficiency
Payback through savings
Waste recovery
Revenue or cost avoidance
Sales access
Programs requiring disclosure
The Implementation Sequence Table
Phase
Focus
Months 1 to 3
Boundary, method, and first data collection
Months 4 to 6
First calculation and internal review
Months 7 to 9
Buyer responses and evidence pack
Months 10 to 12
Improvement actions and baseline confirmation
Year 2
Targets, verification, and refinement
The Metering Investment Table
Scale
Approach
Single workshop
Main meter plus bills
Multiple workshops
Sub-meter per workshop
Process-level analysis
Sub-meter at major equipment
Investigation only
Portable meter
The Verification Options Table
Option
Cost character
Internal review only
Staff time
Second-party customer review
Coordination time
Third-party verification
Periodic fee
Certification audit
Fee plus preparation time
No review
Lowest cost, lowest credibility
The Staff Allocation Table
Task
Time character
Monthly data entry
A few hours per month
Quarterly consolidation
Half a day
Annual reporting
Several days
Questionnaire responses
Per request
Improvement projects
Project-based
Factory note: Twelve months of consistent monthly data is worth more than any single calculated figure. Trends are what allow a factory to claim a reduction, and the trend requires the baseline to be measured properly the first time. Starting the routine early costs very little; reconstructing a year of data afterwards is rarely possible.
Key Terms and Definitions
Buyer questionnaires use terms with specific meanings. Using them consistently is part of producing a response that survives review.
The Core Definitions
Term
Definition
Activity data
A measured quantity of an activity, such as kilowatt hours
Emission factor
Emissions per unit of activity
Carbon dioxide equivalent
Combined greenhouse gas unit
Scope 1, 2, 3
Emission categories by source ownership
Boundary
The limit of what is included
Allocation
Splitting emissions between products
Intensity metric
Emissions expressed per unit of output
Baseline
The reference period for comparison
The Reporting Definitions Table
Term
Meaning in practice
Gate to gate
Factory operations only
Cradle to gate
Materials plus factory
Cradle to grave
Full product life cycle
Verified
Checked by an independent party
Estimated
Derived from averages or models
Recycled content
Proportion of recycled material
The Usage Table
Term
Correct usage
Carbon footprint
A quantified emission figure
Carbon neutral
Only with full substantiation
Reduced emissions
Against a stated baseline
Renewable electricity
With a documented source
Waste recovery
With the recovery route stated
FAQ
Does a small bag factory need to calculate a carbon footprint?
It depends on the buyers, not on the size of the plant. Factories supplying brands with reporting obligations will be asked for energy and emission data regardless of their scale, and the data requirements usually scale with the order volume. Beginning with metered electricity, fuel, material weight, and production volume provides most of what a typical request needs.
What is the difference between Scope 1, Scope 2 and Scope 3?
Scope 1 covers direct emissions from sources the factory owns or controls, such as boiler fuel and generator diesel. Scope 2 covers purchased electricity and heat. Scope 3 covers upstream and downstream value chain emissions, including purchased materials, inbound freight, and outbound freight. In a bag factory, Scope 3 materials usually represent the largest share of the total.
Why do two factories report different figures for the same backpack?
Usually because the boundaries and allocation methods differ. One may have measured gate to gate, covering factory operations only, while the other measured cradle to gate, including purchased materials. Allocation by mass, by unit, or by labour hours also produces different results. Stating the boundary and the allocation method alongside the figure is what makes a comparison valid.
What data should a factory start collecting first?
Electricity consumption, fuel consumption, material purchase weight, production volume, and waste quantity. These five categories cover the bulk of a typical factory footprint and are all obtainable from existing meters, invoices, and production records. Sub-metering by workshop can follow once the routine is established and the main consumption areas are known.
How is an order-level carbon footprint calculated?
Activity data for a defined period is collected across the stated boundary, emission factors are applied to produce emissions by scope, and the total is then allocated to products using a stated method such as mass or unit share. An order footprint is the allocated share for that order, with the boundary, method, and assumptions all stated in the response.
Can a factory claim a product is carbon neutral?
Only with a fully substantiated calculation covering a stated boundary, verified evidence, and a documented treatment of residual emissions. Vague or partially substantiated neutrality claims create legal and reputational exposure for both the brand and the factory, so the safer practice is to report the measured figure, the boundary, and the improvement achieved against the baseline.
What records should be kept to support a reported figure?
Utility invoices, meter reading logs, purchase records, disposal receipts, and the calculation workbook showing the formulas and the emission factor sources. These should be filed by period and retained for a defined retention period. A report without the underlying records cannot be verified, and verification requests are becoming routine rather than exceptional.
Where are the largest reduction opportunities in a backpack factory?
In materials and in operational efficiency, not usually in capital projects. Material type and product weight dominate most footprints, so improved nesting, lower rejection rates, and specification changes with the buyer have the largest effect. On the energy side, compressed air leaks, heat process scheduling, idle machine time, and lighting are the common starting points, and they carry little or no capital cost.
How should a factory respond to a buyer sustainability questionnaire?
Clarify the boundary the buyer expects, extract the data from records that are already maintained, verify it against the source documents, respond in the requested format, and retain a copy with the underlying evidence. Recurring requests should be reviewed periodically so that a standard response template can be prepared, which reduces the effort of each subsequent questionnaire.
Conclusion
Sustainability reporting has become part of the commercial relationship between brands and factories, and the factories best positioned for it are not necessarily the largest ones. They are the ones that measure consistently, state their method, and keep their records.
The practical sequence is straightforward. Define a boundary and write down the method, then start collecting electricity, fuel, material weight, production volume, and waste data every month from sources that already exist.
Apply emission factors, separate the scopes, allocate to products using a stated method, and report the figure with its boundary and assumptions beside it. Then act on what the data shows, beginning with the reductions that cost little and pay back immediately: less cutting waste, fewer rejected units, less idle machine time, and repaired compressed air leaks.
For factories, this work converts an environmental obligation into a commercial capability. A plant that can answer a buyer’s data request with verified figures, and can show which material or design change would reduce the order footprint, participates in product decisions rather than simply receiving specifications.
For buyers, the guidance is to ask for the boundary and the method alongside the number, to request the evidence rather than only the summary, and to treat the factory with the better measurement system as a lower-risk partner. A footprint that is stated precisely enough to be compared is worth far more than one that is merely smaller.