Two factories can build the same backpack with the same machines, the same operators, and the same fabric, and still differ by thirty percent in output. The difference is rarely effort. It is balance — how work is divided between stations, how fast the slowest station runs, and how much work sits waiting between them.
For a bag manufacturer, line balancing is the most direct lever on unit cost. Labor is the largest controllable share of backpack production cost, and unbalanced lines waste it in ways that are invisible on the payroll report but obvious in the delivery schedule.
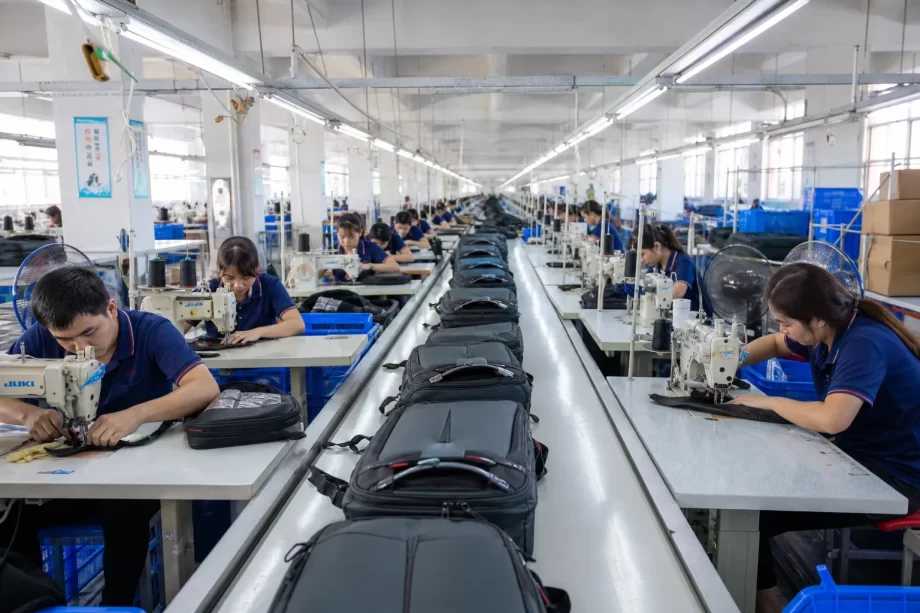
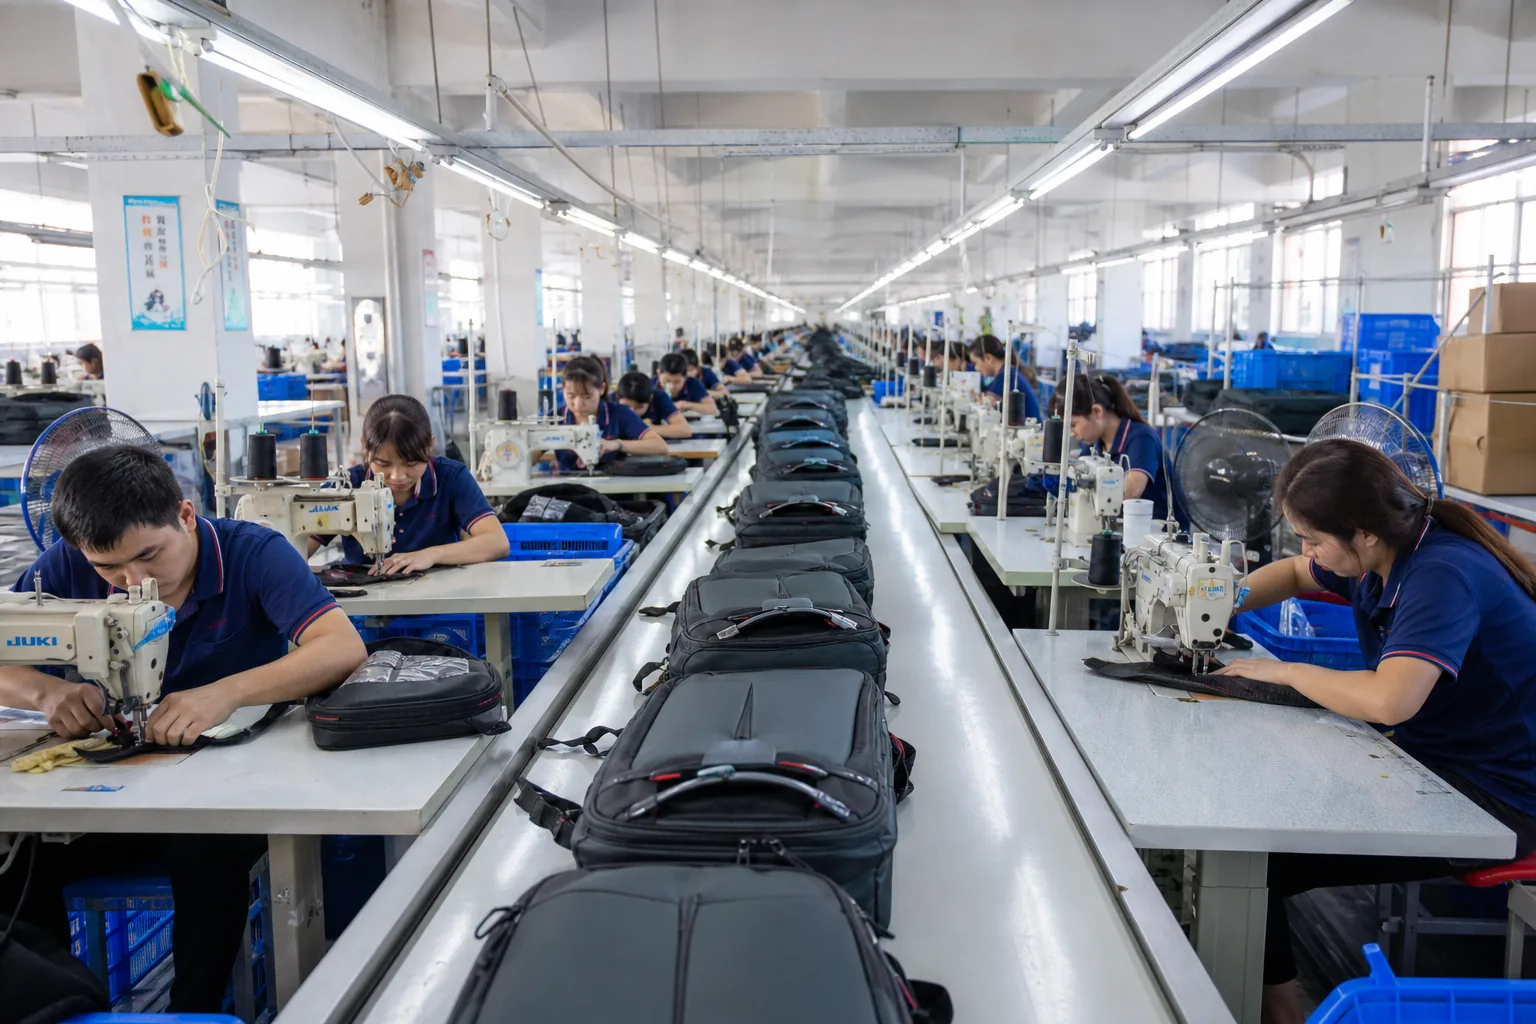
Backpack assembly line with workers at sequential sewing stations
This guide covers the practical engineering of assembly line balancing in backpack production: work measurement, takt time, station design, bottleneck management, material flow, and the metrics that reveal where capacity is actually being lost.
An unbalanced line does not simply run slower. It converts labor into waiting, and waiting is the most expensive form of waste because it is paid for.
Where Unbalanced Lines Lose Money
Loss
How it appears
Idle time
Operators waiting at fast stations
Overproduction
WIP piling up between stations
Rework
Rushing at the bottleneck
Overtime
Recovering the shortfall at day end
Late shipment
Missing the loading date
Expedited freight
Air shipment to protect the delivery
The Cost Anatomy of a Backpack Line
Cost element
Share of unit cost
Direct labor
25–40%
Materials
35–50%
Overhead
10–20%
Quality and rework
3–8%
Logistics and packing
3–6%
The Balance Effect
Line balance level
Efficiency
Relative unit cost
Poorly balanced
55–65%
Baseline plus 25%
Average
70–80%
Baseline plus 10%
Well balanced
85–92%
Baseline
Optimized
93% plus
Baseline minus 5%
The Symptoms of an Unbalanced Line
Symptom
What it indicates
WIP piles at one station
Bottleneck there
Operators idle before a station
Starved by upstream
Frequent overtime
Capacity shortfall
Output varies day to day
Instability
Rework concentrated
Rushed operation
High turnover at one station
Excessive workload
The Balancing Mindset
Traditional view
Balanced view
Push everyone harder
Fix the constraint
Measure output only
Measure flow and balance
Blame operators
Examine the process
Add people
Rebalance work
Accept overtime
Remove the cause
Factory note: Before adding a shift or hiring, measure station cycle times. Most “capacity problems” are bottleneck problems — one station running at 70% of the required takt while four others wait. Adding people to an unbalanced line usually increases WIP rather than output.
The Anatomy of a Backpack Production Line
Backpack assembly has a natural sequence. Understanding it is the prerequisite for balancing it.
The Standard Sequence
Stage
Operations
Preparation
Cutting, bundling, ticketing
Sub-assembly
Pockets, straps, lining
Main assembly
Body panels, zipper, gusset
Final assembly
Lining join, turning, topstitch
Finishing
Hardware, trim, clean
Inspection
In-line and final QC
Packing
Fold, bag, carton
The Station Map
Station
Typical work content
S1
Front pocket assembly
S2
Front panel with zipper
S3
Side and gusset panels
S4
Back panel and shoulder anchors
S5
Straps and harness
S6
Lining assembly
S7
Body join and turning
S8
Hardware setting
S9
Final QC
S10
Packing
The Machine Mix
Machine
Stations served
Single needle lockstitch
Most stations
Double needle
Topstitch, straps
Walking foot
Thick assemblies
Bar tack
Reinforcement
Zigzag
Edge finishing
Post bed
Straps, corners
Heat press
Labels, patches
Rivet or snap press
Hardware
The Line Configuration Options
Configuration
Character
Single sequential line
Simple, balanced flow
Parallel lines
Higher volume
Modular cells
Flexibility, small lots
Hybrid line plus cell
Mixed volume
One-piece flow
Best quality, needs skill
The Work Content Distribution
Work type
Share of total time
Sewing
55–70%
Preparation and handling
15–25%
Hardware and finishing
8–15%
Inspection
5–10%
Packing
3–6%
The Complexity by Product
Product
Operations
Stations
Simple drawstring bag
15–25
4–6
Basic daypack
40–60
8–12
Laptop backpack
60–90
12–16
Technical hiking pack
90–140
16–24
Leather bag
70–110
12–18
Work Measurement Fundamentals
Balancing requires numbers. Work measurement produces them, and it is the step most factories skip.
The Measurement Methods
Method
Accuracy
Cost
Stopwatch time study
High
Moderate
Standard time data
Moderate
Low
Predetermined motion time
High
High setup
Historical output records
Low
None
Expert estimate
Low
None
The Time Study Steps
Step
Action
1
Define the operation boundary
2
Break the work into elements
3
Observe and record a skilled operator
4
Rate performance against normal pace
5
Apply allowances
6
Calculate standard time
7
Validate against output
The Standard Time Formula
Component
Meaning
Observed time
Measured average
Rating factor
Pace adjustment
Basic time
Observed multiplied by rating
Allowances
Fatigue, personal, delay
Standard time
Basic time plus allowances
The Allowance Table
Allowance
Typical value
Personal needs
5%
Basic fatigue
4%
Machine handling
2–4%
Material variation
2–5%
Total typical
13–18%
The Element Types
Element
Contains
Manual
Operator-controlled
Machine
Time determined by machine
Combined
Operator and machine together
Handling
Picking, positioning
Waiting
Idle, to be recalculated
The Sewing Time Benchmarks
Operation
Typical time
Straight seam, 300 mm
15–25 seconds
Curve seam, 300 mm
25–40 seconds
Zipper insertion
60–120 seconds
Strap assembly
90–180 seconds
Box-X reinforcement
20–35 seconds
Bar tack
5–10 seconds
Hardware setting
20–60 seconds
Panel join
60–150 seconds
The Rating Guide
Performance
Description
75%
Slow, hesitant
100%
Normal, consistent
110%
Fast, confident
125%
Exceptional, not sustainable
The Measurement Discipline
Rule
Reason
Measure several cycles
Variation is real
Use a skilled operator
Represents achievable pace
Same methods each time
Comparability
Record the method
Reproducibility
Re-measure after changes
Specs drift
Never use the fastest time
Sets unachievable standards
Factory note: A time study that records only the fastest observed cycle creates a standard nobody can meet, which pushes operators into cutting corners at the bottleneck. Use a consistent skilled operator and record the method alongside the time, so the number stays valid when the process changes.
Balancing Methods and Takt Time
Balancing starts with a target rhythm. Everything else is arithmetic.
The Takt Time Formula
Input
Definition
Available time
Working seconds per shift
Demand
Units required per shift
Takt time
Available time divided by demand
The Takt Calculation Table
Scenario
Available
Demand
Takt
Single shift, 480 min
28,800 s
400 packs
72 s
Single shift, 480 min
28,800 s
300 packs
96 s
Two shifts
57,600 s
800 packs
72 s
Overtime 2 hours
36,000 s
400 packs
90 s
High volume, 1,200
28,800 s
1,200 packs
24 s
The Station Count Formula
Step
Calculation
1
Sum total standard work content
2
Divide by takt time
3
Round up to whole stations
4
Add inspection and packing
The Station Count Example
Item
Value
Total work content
900 seconds
Takt time
72 seconds
Minimum stations
13
Plus QC and packing
15
Actual staffing
15 operators
The Assignment Rules
Rule
Purpose
Keep station time under takt
Achieve the rhythm
Keep station time close to takt
Avoid idle time
Respect precedence
Physical sequence
Group similar machines
Equipment efficiency
Balance workload not task count
Equal time, not equal tasks
The Precedence Constraint
Constraint
Example
Zipper before lining
Zipper accessed first
Pocket before panel join
Pocket sits inside
Straps before lining
Anchors sewn to back panel
Turning after join
Sequence is physical
Hardware after turning
Protection and access
The Balance Efficiency Formula
Measure
Calculation
Balance efficiency
Total work divided by stations times takt
Balance loss
100% minus efficiency
Smoothness index
Variation between station times
The Balance Comparison Table
Configuration
Stations
Bottleneck
Efficiency
Unbalanced
10
95 s at S4
62%
Partly balanced
12
78 s at S4
78%
Well balanced
13
74 s at S7
88%
Optimized
13
71 s
92%
The Balancing Levers
Lever
Effect
Split an operation
Reduces station time
Combine small tasks
Fills idle time
Move work to a sub-assembly
Simplifies main line
Change the machine
Reduces operation time
Add a fixture
Removes handling time
Pre-prepare materials
Cuts non-sewing time
The Rebalance Triggers
Trigger
Action
New style introduced
Full rebalance
Spec change
Re-measure affected stations
Volume change
Recalculate takt
New machine installed
Redistribute work
Quality problem
Adjust load at that station
Factory note: Balance to takt, not to the fastest station. A line where one operator finishes in 50 seconds and the next needs 90 does not produce at 50 seconds — it produces at 90, and the difference is paid idle time across the rest of the line.
Finding and Fixing the Bottleneck
A line always has one constraint. Improving anything else produces no output gain.
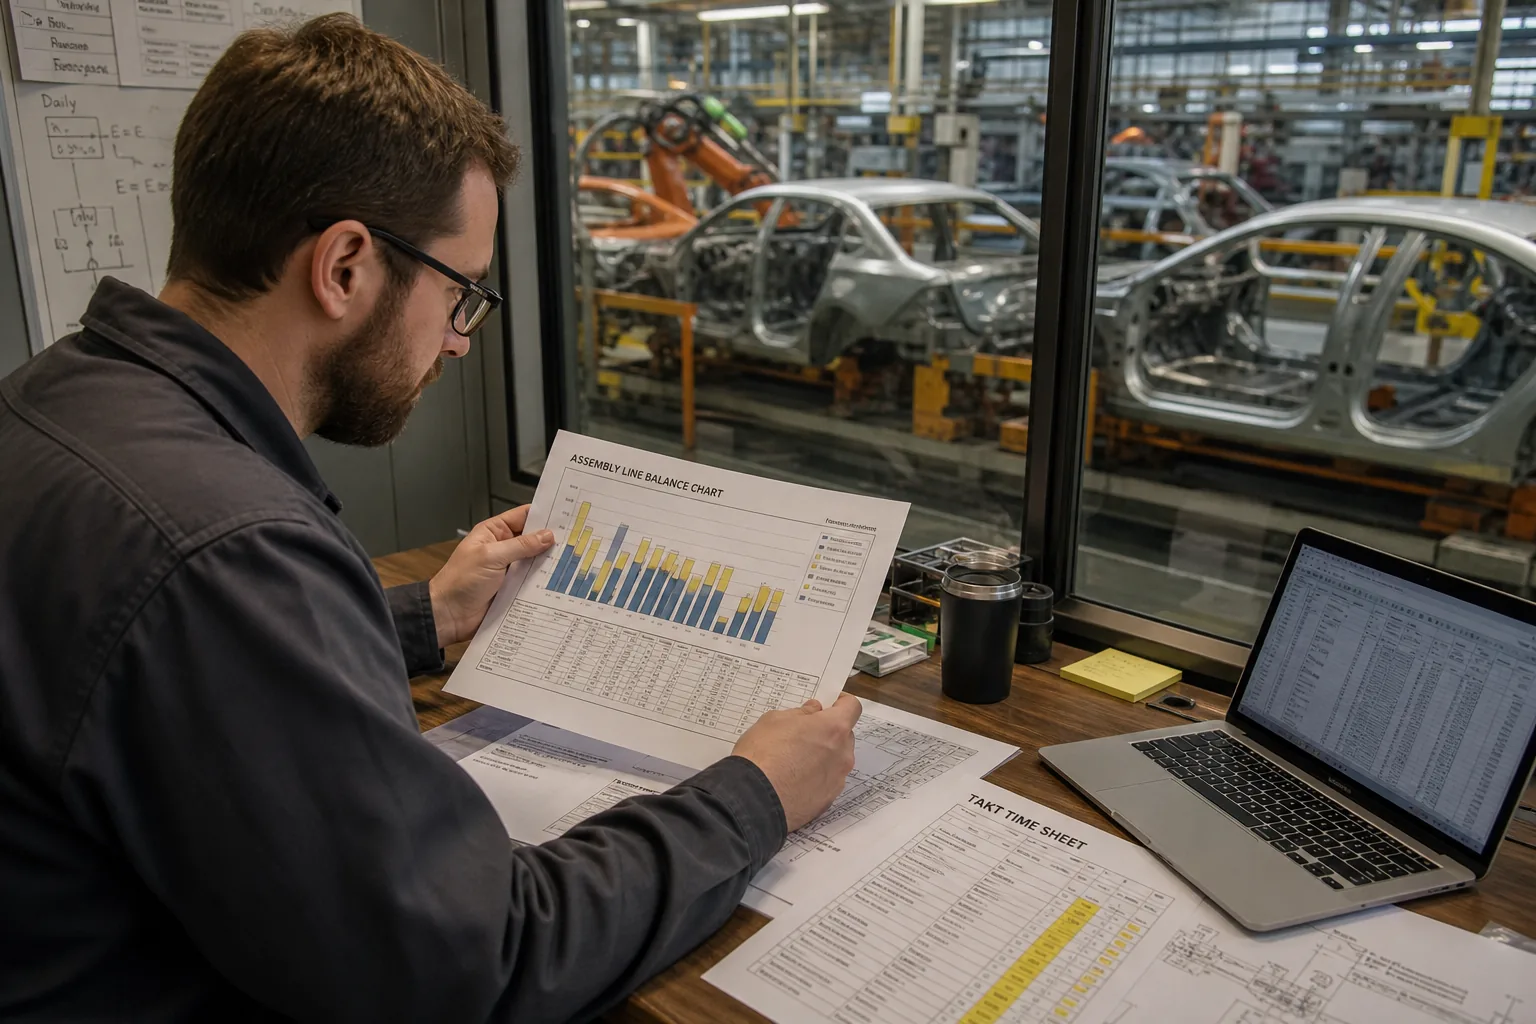
Production planner reviewing line balance chart
The Bottleneck Signals
Signal
Meaning
WIP accumulating upstream
Station cannot keep up
Idle operators downstream
Starved for work
Station runs through breaks
Behind schedule
Output equals that station’s rate
True constraint
Rework originates there
Time loss from corrections
The Constraint Identification Table
Station
Cycle time
Takt
Verdict
S1
62 s
72 s
Capacity available
S2
68 s
72 s
Capacity available
S3
71 s
72 s
Tight
S4
88 s
72 s
Bottleneck
S5
65 s
72 s
Capacity available
The Five Focusing Steps
Step
Action
1
Identify the constraint
2
Exploit it fully
3
Subordinate the rest to it
4
Elevate it
5
Repeat after it moves
The Exploitation Tactics
Tactic
Effect
Protect the station with a buffer
Reduces starvation
Feed it prepared materials
Removes handling
Assign the best operator
Consistent pace
Remove inspection from it
Keeps it productive
Provide tool backup
Avoids downtime
Pre-stage consumables
No searching
The Elevation Options
Option
Cost
Split the operation
Low
Add a machine
Moderate
Add a station
Moderate
Improve the method
Low
Extend hours there only
Low, limited
Why Not Just Add People
Approach
Effect
Add operator at bottleneck
Output rises to next constraint
Add operator elsewhere
No output change
Add operator without method fix
Partial gain only
The Moving Bottleneck
After fixing S4
New constraint
S4 reduced to 70 s
S3 at 71 s
S3 reduced to 66 s
S2 at 68 s
S2 reduced to 65 s
S1 or finishing
Each improvement moves the constraint downstream. Balancing is continuous, not a one-time project, because the slowest station changes whenever work is redistributed.
Line Layout and Material Flow
Layout determines how much time is spent sewing and how much is spent moving.
The Layout Options
Layout
Character
Straight line
Simple flow, long footprint
U-shaped line
Compact, flexible staffing
Parallel lines
Volume, equipment duplicated
Modular cells
Complete unit in one cell
Hybrid
Mixed model production
The Layout Comparison Table
Factor
Straight
U-shape
Cell
Footprint
Largest
Small
Smallest
Material travel
Long
Short
Shortest
Flexibility
Low
Moderate
High
Supervisor span
Easy
Easy
Demanding
Skill requirement
Low
Moderate
High
WIP level
High
Moderate
Low
The Material Feeding Methods
Method
Character
Bundle system
Cut pieces tied in bundles
Hand-to-hand
Passed directly
Kanban pull
Replenished on signal
Kitting
Complete set pre-assembled
Continuous feed
Conveyor or rail
The Feeding Comparison
Method
WIP
Control
Bundle
High
Easy counting
Hand-to-hand
Low
Requires balance
Kanban
Moderate
Visual
Kitting
Low
Strong control
Continuous
Moderate
Line paced
The WIP Standards
Station
Target WIP
Preparation buffer
30–60 min
Between stations
1–3 units
Before bottleneck
2–5 units
Before QC
5–10 units
Completed goods
0, move to packing
The Transport Waste Table
Waste
Cause
Long carry distance
Poor layout
Double handling
Wrong bin position
Searching
Unlabeled containers
Re-stacking
Insufficient storage
Waiting for a tote
Too few containers
The Point-of-Use Rules
Rule
Benefit
Materials within reach
No walking
Tools at the station
No searching
Thread at height
Easy change
Cutters and scissors fixed
Time saving
Scrap bin at hand
Clean station
The Ergonomics Connection
Condition
Effect
Correct table height
Faster, less fatigue
Good lighting
Fewer defects
Adjustable seating
Sustained pace
Anti-fatigue mats
Lower fatigue
Task rotation
Fewer strain injuries
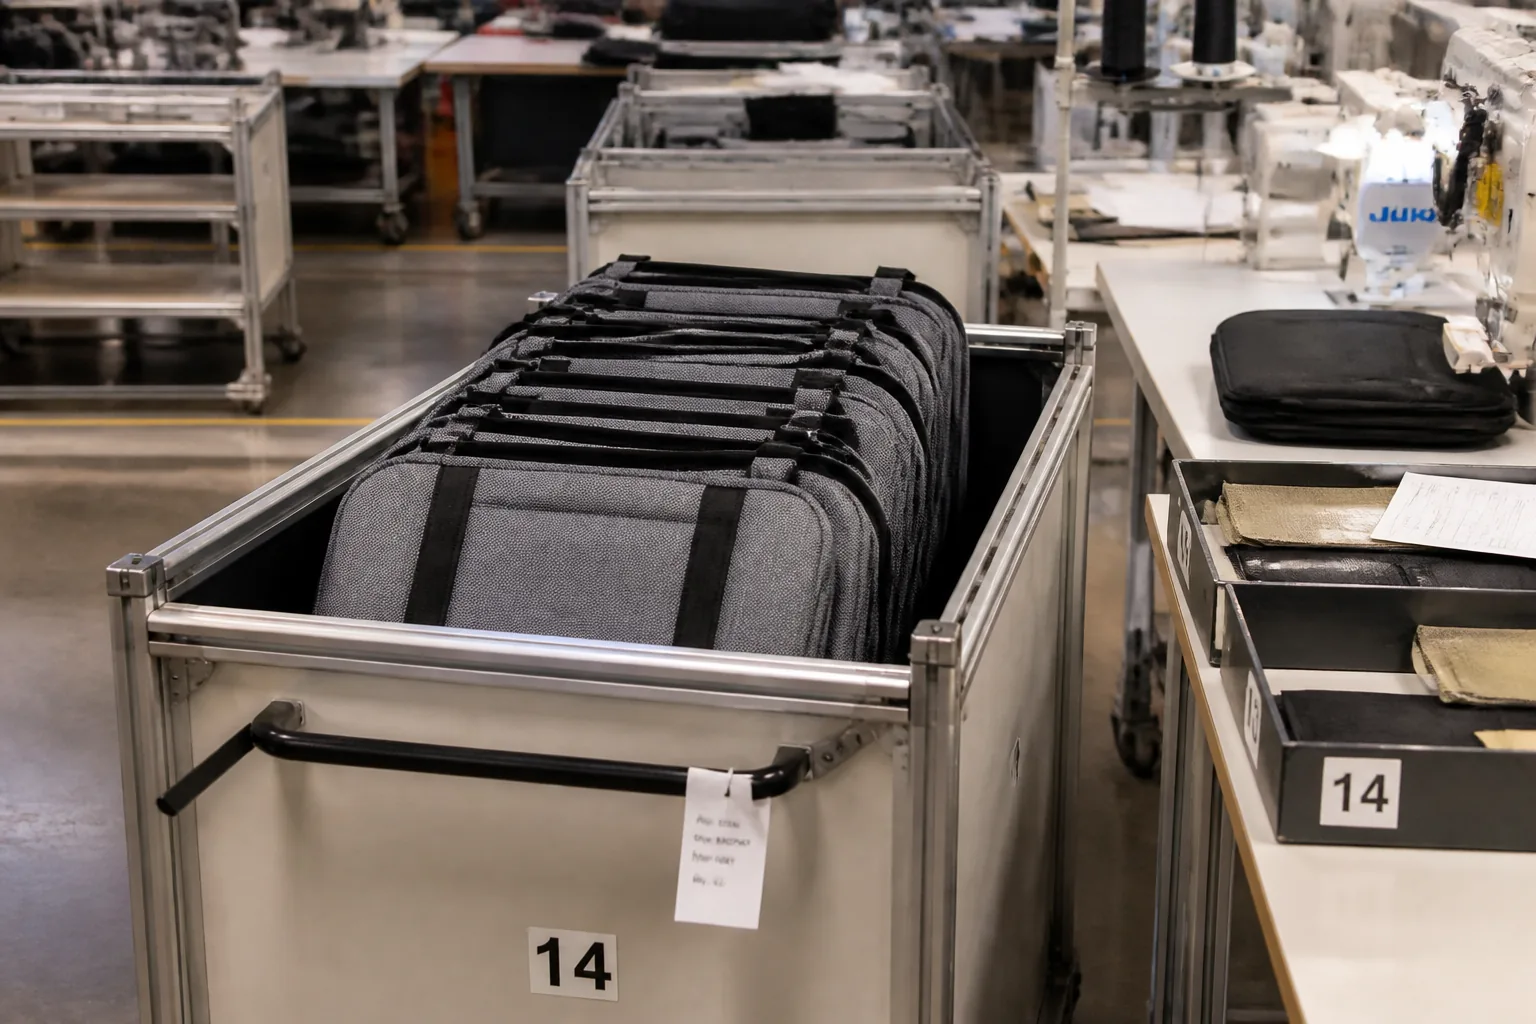
Work-in-progress bundles moving between sewing stations
Efficiency Metrics That Drive the Right Behaviour
Metrics shape decisions. A factory measuring only daily output will sacrifice quality and flow to hit a number.
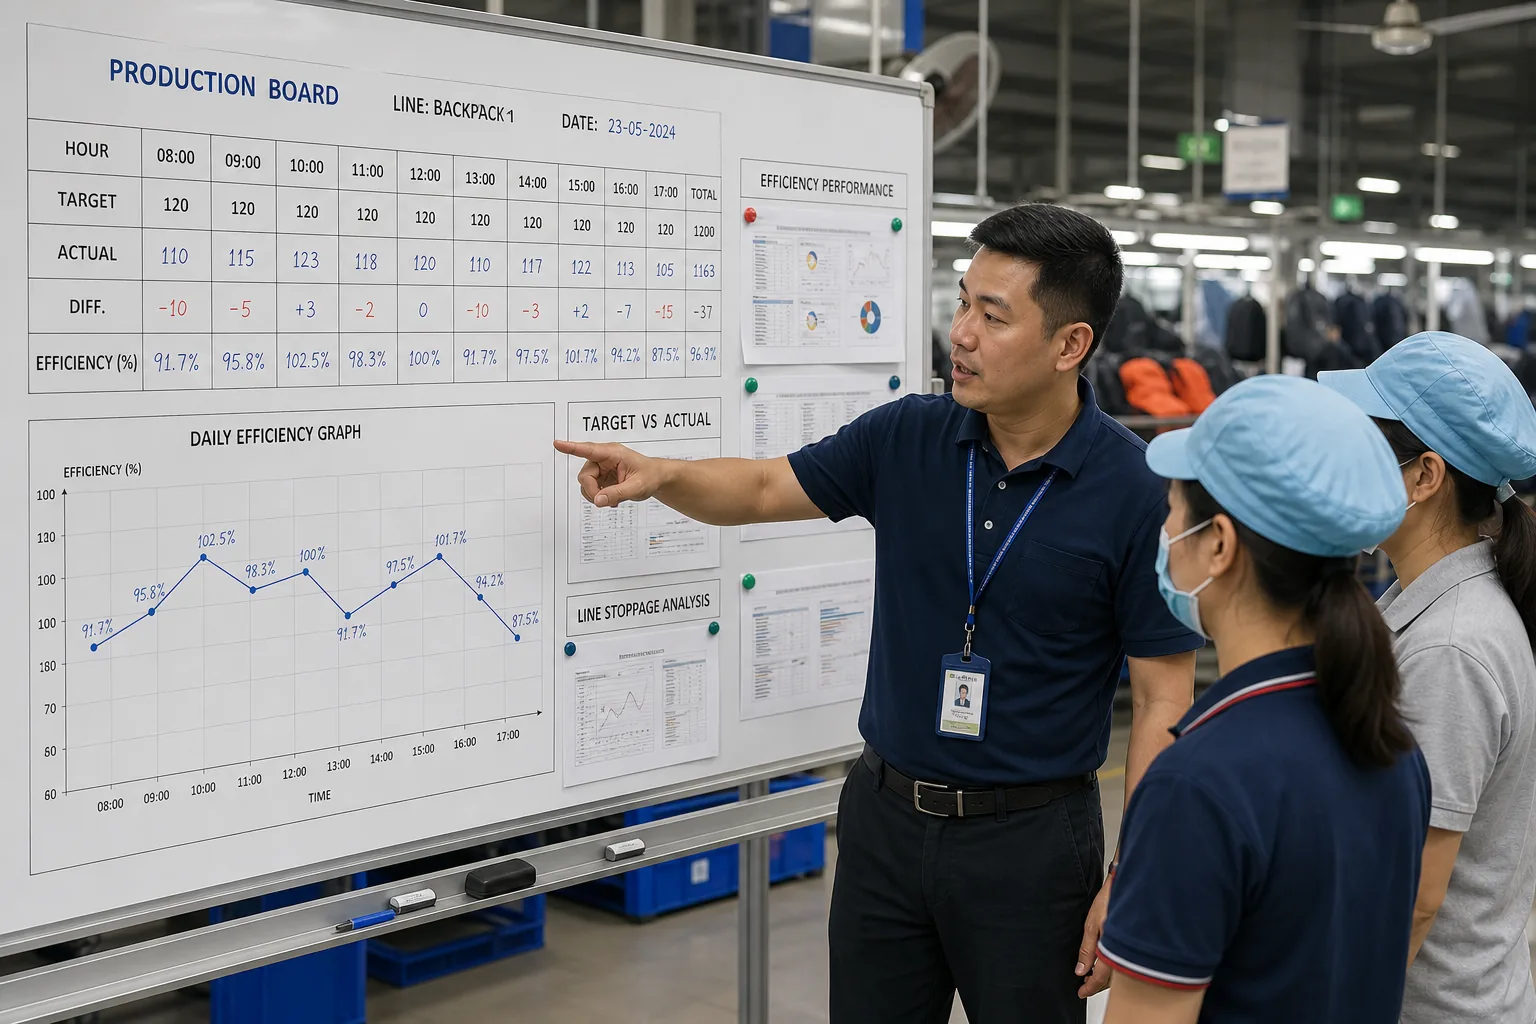
Production board tracking hourly output and efficiency
The Core Metrics
Metric
Definition
Line efficiency
Standard minutes produced divided by minutes worked
Throughput
Units completed per shift
First pass yield
Units passing without rework
Balance rate
Efficiency of work distribution
Rework rate
Rework minutes over total minutes
Absenteeism
Operators absent over scheduled
Overtime ratio
Overtime hours over regular
The Standard Minute Concept
Element
Explanation
Standard time
Engineered time for an operation
Pieces produced
Units completed
Standard minutes
Standard time multiplied by pieces
Minutes worked
Actual attendance time
Efficiency
Standard minutes over minutes worked
The Efficiency Calculation Table
Scenario
Standard minutes
Minutes worked
Efficiency
Weak line
5,400
9,000
60%
Average line
6,750
9,000
75%
Good line
7,850
9,000
87%
Strong line
8,370
9,000
93%
The Metric Interaction Table
If you push
Side effect
Volume only
Rework rises
Speed only
Quality drops
Quality only
Throughput falls
Flexibility only
Efficiency dips
Efficiency only
Skill development stalls
The Balanced Scorecard
Dimension
Sample metric
Productivity
Line efficiency
Quality
First pass yield
Delivery
On-time completion
Cost
Rework minutes
People
Absenteeism, turnover
Safety
Recordable incidents
The Reporting Cadence
Frequency
Reported
Hourly
Output against plan
Daily
Efficiency, yield, WIP
Weekly
Balance, rework trends
Monthly
Trend review and actions
The Interpretation Traps
Trap
Problem
High efficiency with high rework
Output counted twice
Output counted before QC
Inflated figure
Ignoring absenteeism
Unfair comparison
Comparing different styles
Not comparable
Using output only
Quality erosion
Factory note: Never measure a line on output alone. A line producing 20% more with 15% rework is not more efficient than a stable line at target — it is transferring cost from labor into rework, freight, and returns, where it is harder to see and more expensive to fix.
Maintaining Quality at Line Speed
Speed increases pressure on quality. The line must be designed so quality does not depend on individual discipline.
The Quality-at-Source Rules
Rule
Effect
Build in rather than inspect out
Fewer escapes
Self-check at each station
Immediate detection
Stop at defect
No defect propagation
Standard work instructions
Consistent method
Visual standards
Shared reference
The In-Line Check Points
Check
Location
First article
Line start
Panel check
After main assembly
Stitch check
After topstitch
Hardware check
After setting
Function check
Before packing
Final audit
Before carton
The Defect Cost Escalation Table
Discovery point
Relative cost
At the station
1×
At end-of-line QC
4×
At final audit
10×
At customer
40× plus
The Rework Routing Rules
Situation
Action
Minor at station
Fix immediately
Repeat defect
Stop and investigate
Component defect
Quarantine the lot
Design issue
Escalate before continuing
Salvage uncertain
Isolate for decision
The Speed-Quality Balance Table
Line speed
Quality risk
Below normal pace
Low, cost high
At takt
Balanced
10% above takt
Rising
20% above takt
High
Sustained above
Unacceptable
The Skill Effect
Skill level
Rework rate
Beginner
High
Trained, less than 6 months
Moderate
Experienced
Low
Multi-skilled
Lowest, flexible
Changeover and Flexibility
Modern backpack orders are smaller and more frequent. Line flexibility determines whether that is profitable or painful.
The Changeover Elements
Element
Time driver
Machine setting
Thread, needle, tension
Fixture change
Attachments and guides
Layout change
Station rearrangement
Material change
Different fabric or color
Documentation
Work instructions
First article
Verification
The Changeover Time Table
Change type
Typical time
Color change only
15–40 min
Style change, same family
1–3 hours
Different product family
4–8 hours
New style, first run
1–2 days
The SMED Approach
Step
Action
Separate internal and external work
Understand the changeover
Convert internal to external
Pre-prepare off-line
Streamline remaining steps
Simplify
Standardize
Repeatable, timed
Practice
Reduce time
The Pre-Preparation Table
Item
Prepared in advance
Threads
Color, type, wound bobbins
Needles
Size matched to material
Fixtures
Attachments ready
Cut pieces
Bundled and ticketed
Labels
Printed and sorted
Instructions
Posted at stations
The Flexibility Options
Option
Benefit
Multi-skilled operators
Stations can be re-balanced
Modular cells
Small lots viable
Quick-change attachments
Fast setup
Standardized work content
Predictable timing
Small buffers
Absorb changeover disruption
The Cell Layout Comparison
Factor
Line
Cell
Minimum lot
High
Low
Changeover
Long
Short
Efficiency at volume
Highest
Slightly lower
Skill demand
Lower
Higher
Quality feedback
Slower
Immediate
WIP
Higher
Lower
The Order Sequencing Rules
Rule
Reason
Group similar styles
Shorter changeovers
Sequence light to dark
Avoid contamination
Run larger lots first
Absorb changeover
Keep urgent orders on a fast lane
Protect delivery
Never change changeover mid-lot
Cost and confusion
Factory note: Changeover time is a design variable, not a fixed attribute of the product. Factories that pre-prepare threads, fixtures, and bundles before the line stops typically cut changeover by half — with no capital investment, only discipline.
Multi-Skilling and Workforce Flexibility
A balanced line depends on people who can move. Skill coverage is what makes rebalancing possible without hiring.
The Skill Matrix
Operator
S1
S2
S3
S4
S5
S6
A
Full
Full
Basic
–
–
Basic
B
Basic
Full
Full
Basic
–
–
C
–
Basic
Full
Full
Full
Basic
D
Basic
–
Basic
Full
Full
Full
E
Full
Basic
–
Basic
Full
Full
The Skill Level Definitions
Level
Meaning
Trained
Can perform with supervision
Basic
Independent at normal pace
Full
Independent, correct quality, normal time
Trainer
Can teach others
The Coverage Rules
Rule
Reason
Two operators per critical station
Absence cover
Three for the bottleneck
Protect output
Rotate monthly
Skill retention
Train ahead of need
Ramp readiness
Document skill levels
Planning visibility
The Rotation Benefits
Benefit
Effect
Reduced fatigue
Sustained pace
Fewer strain injuries
Lower absence
Coverage flexibility
Rebalance at will
Skill growth
Retention
Better problem-solving
Wider perspective
The Training Time Table
Operation
Time to competence
Straight seams
1–2 weeks
Panel assembly
3–4 weeks
Zipper insertion
4–6 weeks
Strap and harness
6–8 weeks
Hardware setting
2–3 weeks
Final QC
4–6 weeks
The Training Methods
Method
Use
Show and tell
New operations
Guided practice
Skill building
Standard work sheet
Reference
Buddy system
Transition to production
Defect library
Quality awareness
Timed practice
Pace development
The Productivity Ramp
Period
Productivity
Week 1
40–50%
Week 2
60–70%
Week 3
75–85%
Week 4
85–95%
Week 6 plus
Full pace
Factory note: Plan the first weeks of a new style or a new team at reduced efficiency. A schedule that assumes full pace from day one will be behind by the end of week one, and the recovery costs more than the realistic plan would have.
Line Start-Up and Ramp-Up
New styles and new lines rarely achieve target output immediately. Ramp-up is a planned phase, not a surprise.
The Start-Up Sequence
Phase
Focus
Sample line
Method proof
Pilot lot
Small volume validation
First production lot
Learning curve
Stable production
Target efficiency
Improvement
Continuous refinement
The Ramp-Up Curve Table
Lot
Typical efficiency
Pilot, 50 units
45–60%
First lot, 500 units
70–80%
Second lot
85–90%
Third lot onward
90–95%
The Start-Up Checklist
Item
Done
Standard work instructions posted
☐
Station layout verified
☐
Cycle times measured
☐
Balance confirmed
☐
Materials staged
☐
First article approved
☐
Defect standards displayed
☐
Trained operators assigned
☐
The Common Ramp-Up Problems
Problem
Cause
Output below target
Unrealistic standard or method issue
Rework high
Instructions unclear or training short
WIP accumulating
Balance broken at one station
Material shortages
Planning or kit errors
Quality drifting
Standards not visible
The Corrective Actions
Problem
Action
Below target output
Re-measure and rebalance
High rework
Retrain at the source station
WIP pile-up
Fix the constraint
Shortages
Correct the kit process
Quality drift
Re-post visual standards
Improvement Roadmap for a Backpack Line
Efficiency improvement follows a sequence. Skipping steps usually creates problems that cost more than the gains.
The Improvement Priority Table
Priority
Action
Typical gain
1
Measure work content properly
Foundation
2
Balance to takt
10–20%
3
Fix the bottleneck
5–15%
4
Reduce changeover
3–10% on mixed orders
5
Improve ergonomics
3–8%
6
Standardize work
5–10%
7
Multi-skill the team
5–15%
8
Automate selectively
10% plus, high cost
The Low-Cost Improvement Table
Action
Investment
Time study and rebalance
Time only
Pre-staged materials
Small
Fixtures and guides
Low
Visual standards
Low
Hanger and bin placement
Low
Skill matrix and rotation
Training time
Hourly output board
Low
The Capital Improvement Table
Action
Cost
Justification
Additional machine
Moderate
Relieve bottleneck
Automated cutter
High
Cutting capacity
Bar tack automation
Moderate
Reinforcement speed
Conveyor or rail
High
Flow, high volume
Digital tracking
Moderate
Visibility
The Improvement Measurement
Metric
Baseline
Target
Line efficiency
75%
88%
First pass yield
92%
97%
Changeover time
3 h
1.5 h
WIP between stations
10 units
3 units
Rework minutes
8%
3%
The Project Discipline
Rule
Reason
Change one thing at a time
Cause and effect
Measure before and after
Evidence
Involve the operators
Practical solutions
Standardize the gain
Prevent regression
Train to the new method
Sustain
Review monthly
Momentum
The Data Requirements
Data
Frequency
Station cycle times
Per style
Hourly output
Daily
Defect by station
Daily
Rework minutes
Daily
Absenteeism
Daily
Changeover time
Per event
Efficiency Checklists for Buyers
Buyers can assess a factory’s line discipline quickly, because balance problems are visible on the floor.
The Walkthrough Signals
Observation
Meaning
WIP piled at one station
Bottleneck present
Operators waiting
Starved line
Missing work instructions
Method not standardized
No hourly board
Output not monitored
Scattered tools
Time lost to searching
Untidy stations
Weak discipline
No skill matrix visible
No flexibility plan
The Buyer’s Questions
Question
What it reveals
What is your takt time for this order?
Whether planning exists
How many stations and operators?
Line structure
What is your current line efficiency?
Performance awareness
Where is your bottleneck?
Problem understanding
How long is changeover?
Flexibility
How do you measure rework?
Quality control
Who covers absence?
Continuity
The Capacity Verification Table
Claim
Verification
Daily output
Observe and count
Line efficiency
Ask for standard minutes
On-time delivery
Historical records
Quality level
Defect records
Changeover time
Observe a change
The Capacity Calculation Check
Item
Formula
Daily capacity
Available time divided by takt
Realistic capacity
Capacity multiplied by efficiency
Order feasibility
Units divided by realistic capacity
Delivery date
Volume divided by weekly capacity
Factory note: When a factory quotes a delivery date, ask which line will run the order and what else is scheduled there. A capacity number is only meaningful against the actual line loading — a factory at 95% utilization cannot absorb a rush order without displacing something else.
FAQ
What is takt time and why does it matter in backpack production?
Takt time is the available working time divided by the number of units the customer requires in that period. It sets the rhythm every station must achieve. If a line must produce 400 backpacks in a 480-minute shift, takt time is 72 seconds and every station must complete its assigned work within that window.
How many stations does a backpack assembly line need?
Divide total standard work content by takt time. If the work content is 900 seconds and takt time is 72 seconds, the minimum is 13 stations, plus inspection and packing. Typical lines run 8–12 stations for basic daypacks, 12–16 for laptop packs, and 16–24 for technical hiking packs.
What line efficiency should a backpack factory achieve?
Average lines run 70–80%, well-balanced lines reach 85–92%, and optimized lines exceed 93%. Efficiency is standard minutes produced divided by minutes worked, so a plant at 60% is losing nearly half of paid labor time to imbalance, waiting, and rework.
How do I identify the bottleneck on a production line?
Look for the station with work-in-progress piling up in front of it and idle operators after it. Confirm by comparing station cycle times against takt — the station whose cycle time exceeds takt is the constraint. Output cannot exceed that station’s rate regardless of how fast the others run.
Should a factory add operators or rebalance work to raise output?
Rebalance first. Adding an operator to an unbalanced line usually increases WIP rather than output, because the constraint remains. Splitting the bottleneck operation, moving work to a sub-assembly, or adding a fixture typically delivers the gain at a fraction of the cost.
How long does it take a new backpack style to reach full output?
Expect 45–60% efficiency on a pilot lot, 70–80% on the first production lot, and 85–90% by the second lot, with full pace from the third lot onward. Scheduling a new style at full pace from day one is the most common cause of late delivery on first orders.
How can changeover time be reduced without new equipment?
Pre-prepare everything that can be done while the line is still running — threads, wound bobbins, needles, fixtures, cut and ticketed bundles, labels, and posted instructions. Then standardize the remaining internal steps and time them. Factories using this approach typically halve changeover with no capital investment.
What single metric best reflects line performance?
No single metric is sufficient. Line efficiency shows labor utilisation, first pass yield shows quality, WIP level shows flow health, and rework minutes show hidden cost. A line producing 20% more with 15% rework is not more efficient — it has moved cost into rework, freight, and returns.
Conclusion
Line balancing is arithmetic applied to people, machines, and material — and it is the fastest route to lower unit cost in backpack production without buying anything.
For production teams, the sequence is stable. Measure the work content properly with a consistent skilled operator. Calculate takt time from real demand. Assign operations to stations so each is within takt and as close to it as possible.
Find the constraint, exploit it before elevating it, and accept that it will move once relieved. Feed the line with pre-staged, pre-kitted materials so operators sew rather than search. Verify quality at the source rather than at the end, because defect cost multiplies by forty between the station and the customer. Then measure efficiency, first pass yield, WIP, and rework together, and report them daily.
For buyers, the same facts are visible on a walkthrough: where the WIP piles up, how long changeover takes, whether instructions are posted, and whether anyone can state the takt time. A factory that can answer those questions is a factory that can hold a delivery date.