Cutting Water and Energy in Bag Factories: Where Do You Start?
Cutting Water and Energy in Bag Factories: Where Do You Start?
Water and energy are the two costs in a bag factory that no one owns. They arrive on a utility bill, are absorbed into overhead, and are never attributed to a style, an order, or a department. That is precisely why they are usually both large and improvable.
This guide covers water and energy reduction from a bag manufacturer’s perspective: why utilities behave differently from material cost, where water is actually used in bag production, which measures reduce it, how wastewater is handled, where energy load sits, which interventions pay, how metering makes any of it verifiable, and how baselines and reporting hold the programme together.
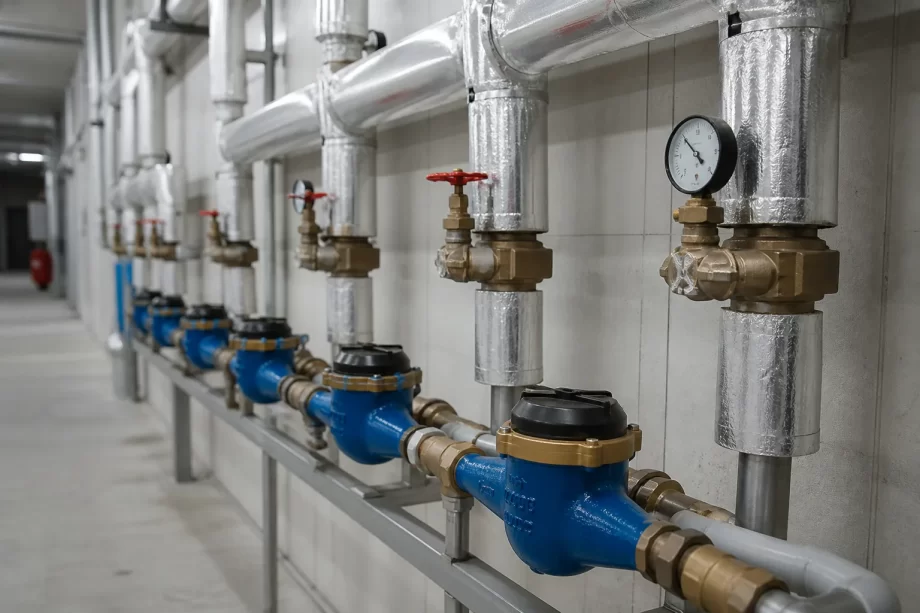
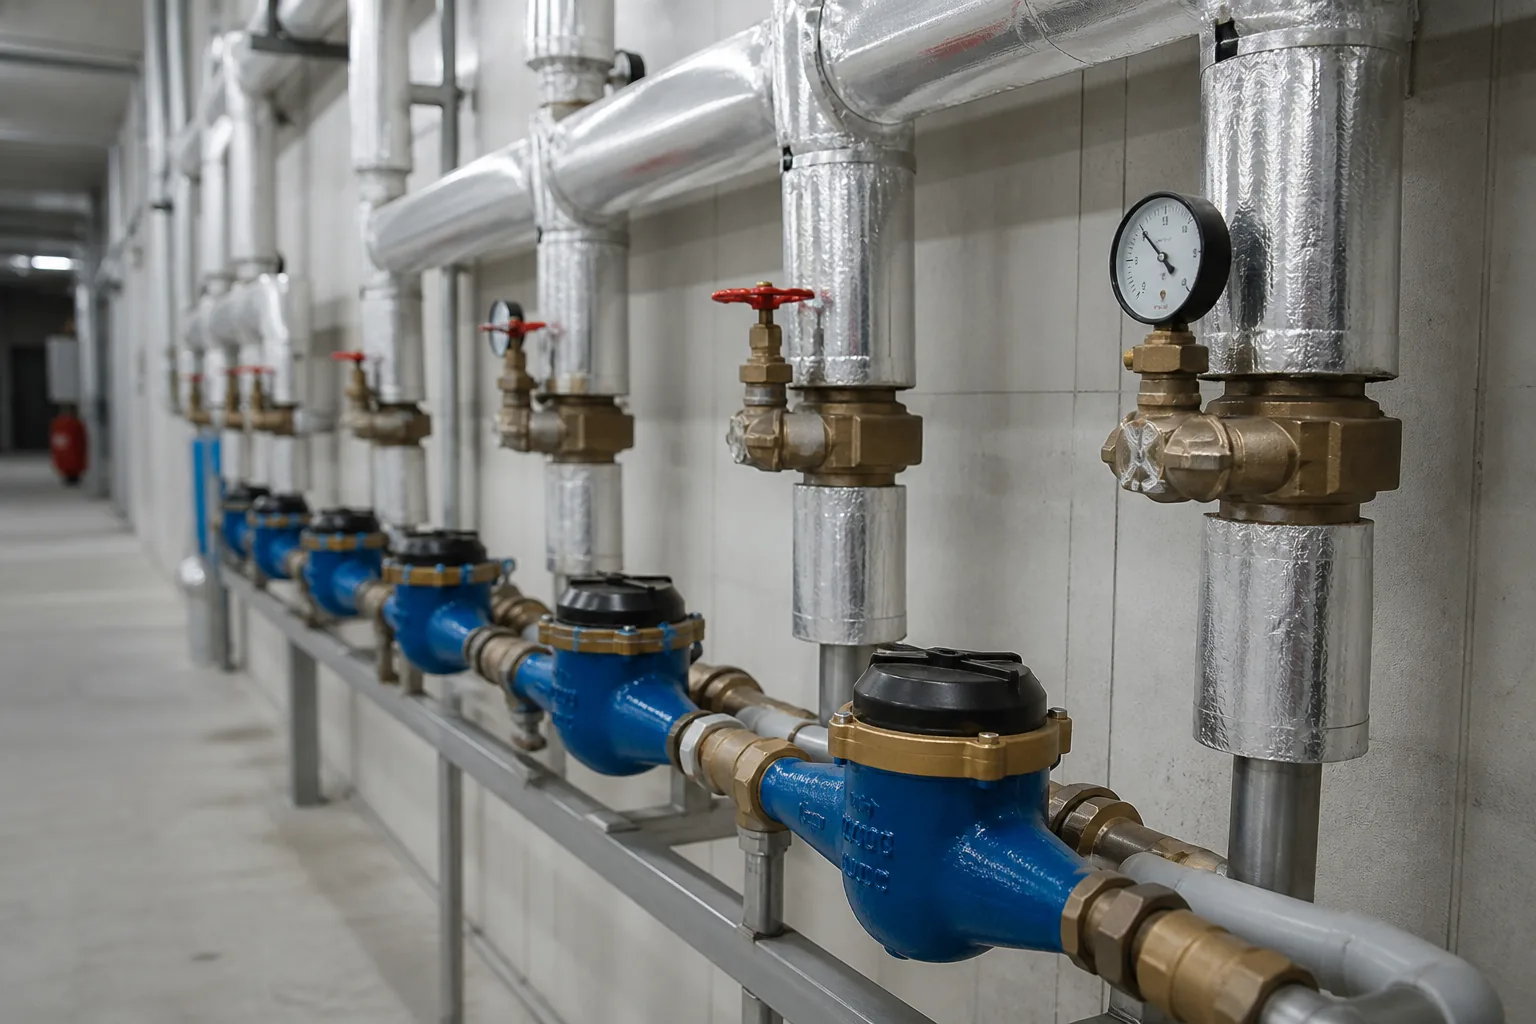
Water meters, insulated steam pipes and valves in a bag factory utility area
A factory can quote a bag to the cent on fabric, hardware, and labour, and still not know what the bag costs in electricity and water. The gap exists because utilities are measured at the gate rather than at the process, and an unmetered cost cannot be managed, allocated, or reduced with any confidence.
A utility bill tells a factory how much it spent. A submeter tells it where. Only the second number can be acted on.
The Cost Structure Table
Characteristic
Material cost
Utility cost
Measurement point
Per order
Per site
Attribution
Direct
Overhead
Variability
Known
Largely hidden
Reduction lever
Sourcing
Process and equipment
Capital intensity
Low
Medium to high
Payback visibility
Immediate
Delayed
The Driver Table
Driver
Effect on consumption
Machine idle time
Energy with no output
Oversized motor
Continuous part-load loss
Steam and air leaks
Permanent baseline increase
Single-pass cooling water
Water used once
Batch size
Fixed load spread thinner
Shift pattern
Base load carried longer
The Missed Opportunity Table
Assumption
Reality
Utilities are fixed
Most are variable per unit
Savings need investment
Leaks and idle time are free
The bill is the data
It is an aggregate
Sustainability is marketing
It is operating cost
One project is enough
Gains decay without monitoring
Buyers do not care
Increasingly they ask for numbers
Where Water Is Used in Bag Production
Most bag factories do not dye or finish fabric, so the water footprint is smaller than a textile mill’s. It is not zero, and the points where it is used are concentrated and therefore tractable.
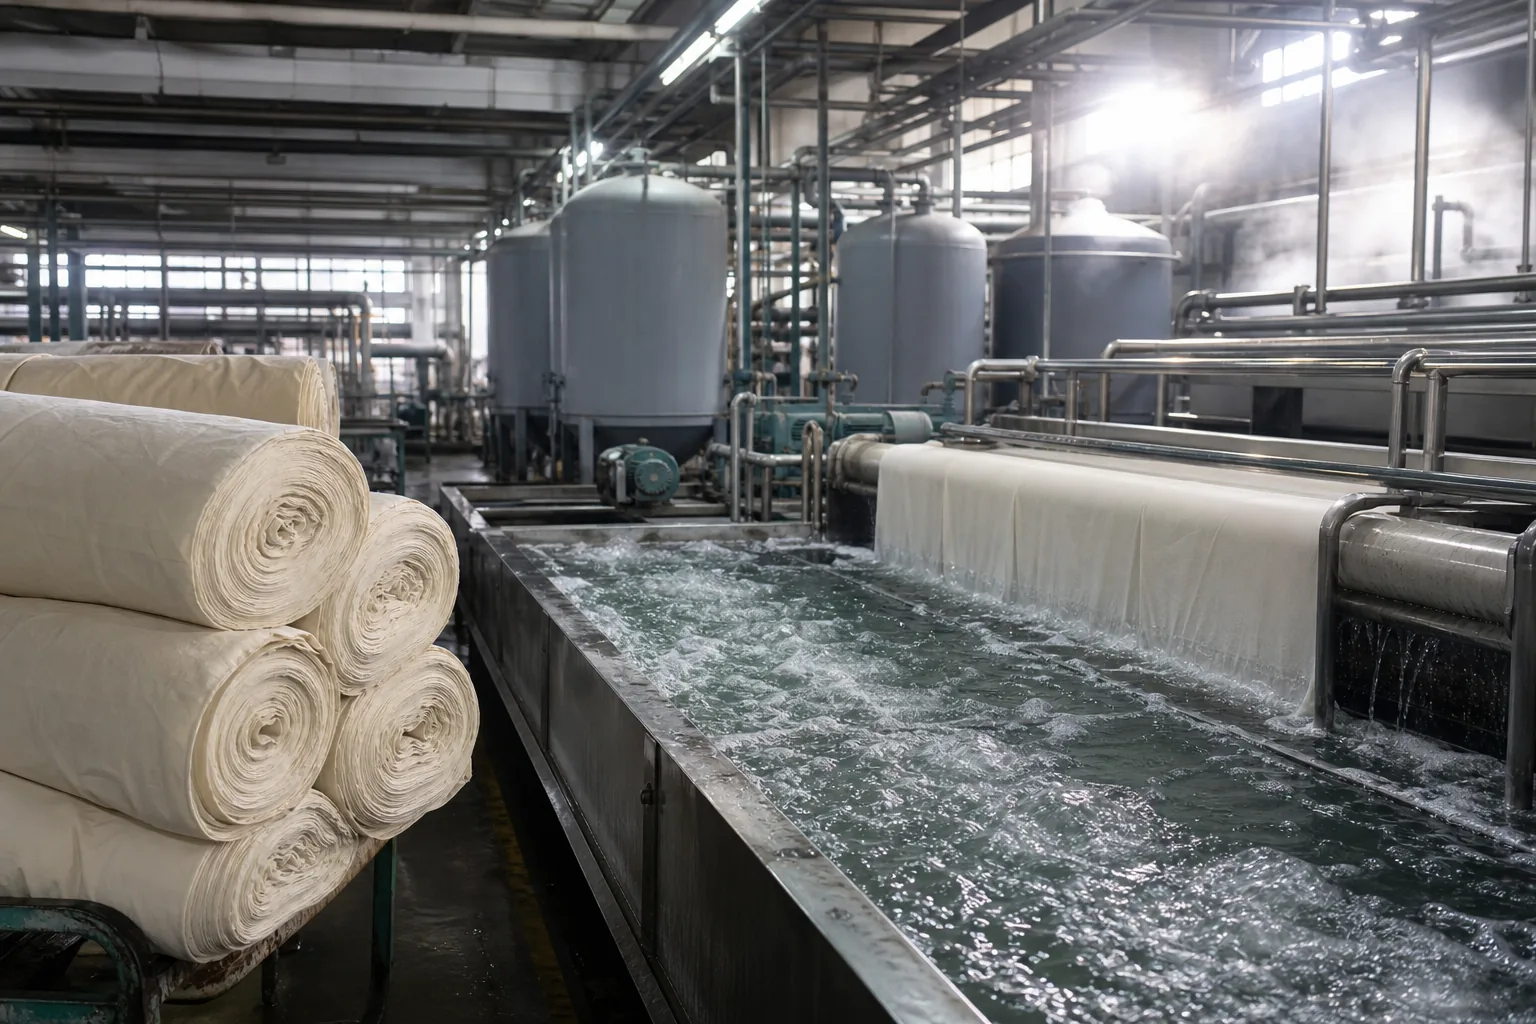
Fabric rolls beside a washing bath with recirculation tanks and pipework in a wet processing area
The Use Point Table
Use point
Character
Boiler makeup
Continuous, quality-critical
Cooling
Often once-through
Equipment cleaning
Batch, high volume
Floor washing
Daily, low control
Sample washing
Small but frequent
Sanitary and canteen
Steady, unmetered
The Consumption Profile Table
Profile
Consequence
Peak at shift change
Pressure drop and waste
Continuous bleed
Silent, year-round loss
Manual hose use
Volume set by habit
Cleaning without control
Over-rinsing
No recovery
Discharge to drain
No submetering
Invisible to management
The cheapest water saving in most plants is a nozzle, a trigger, and a rule about who opens the valve.
The Water Quality Table
Parameter
Why it matters
Hardness
Scale in boiler and pipes
Conductivity
Corrosion and carryover
pH
Treatment effectiveness
Suspended solids
Fouling and blockages
Iron and manganese
Staining and deposits
Temperature
Efficiency and biology
The Loss Table
Loss
Typical cause
Leak
Worn valve or joint
Overflow
Float valve failure
Evaporation
Open hot tank
Blowdown
Excess boiler discharge
Rinse excess
No counterflow
Discharge
No reuse path
Water Reduction Measures
Reduction follows a fixed order: eliminate what does not need water, then control what does, then recover what leaves. Factories that start with recovery invest in equipment before they have fixed the free losses.
The Measure Table
Measure
Cost
Effect
Leak survey and repair
Low
Immediate baseline cut
Trigger nozzles
Low
Cuts cleaning volume
Flow restrictors
Low
Caps peak draw
Counterflow rinsing
Low
Cuts rinse water sharply
Closed cooling loop
Medium
Removes once-through use
Condensate recovery
Medium
Returns boiler-grade water
Rainwater harvesting
Medium
Displaces utility water
Treatment and reuse
High
Displaces the largest share
The Priority Table
Order
Action
First
Stop the leaks
Second
Meter each area
Third
Change cleaning practice
Fourth
Close open loops
Fifth
Recover condensate
Sixth
Treat and reuse
The Cleaning Practice Table
Practice
Water consequence
Hose left running
Continuous waste
Bucket washing
Controlled volume
Dry scraping first
Less water needed
Foam and dwell
Shorter rinse
Scheduled cleaning
Avoids repeat work
Trained operator
Volume discipline
Cleaning is the largest controllable water use in most bag plants, and it is decided by habit rather than by engineering.
The Recovery Table
Source
Reuse path
Boiler condensate
Feedwater
Cooling loop
Recirculation
Final rinse
Earlier rinse stage
Rain
Non-contact uses
Treated effluent
Floor washing
Filter backwash
Settling and reuse
Wastewater and Treatment
Whatever is not reused leaves the site, and what leaves the site is regulated. Bag plants generate effluent from cleaning, boiler blowdown, and any washing operation, and the load is usually lower than a dyehouse but not negligible.
The Effluent Table
Parameter
Source
pH
Cleaning chemicals
Suspended solids
Fibre and lint
Oil and grease
Machine areas
COD
Detergents and finishes
Colour
Any wet processing
Temperature
Blowdown and cooling
The Treatment Table
Stage
Function
Screening
Removes lint and solids
Equalisation
Smooths flow and load
Sedimentation
Settles solids
Biological treatment
Reduces organic load
Filtration
Polishes for reuse
Disinfection
Controls biology
The Compliance Table
Requirement
Consequence of failure
Discharge permit
operating restriction
Sampling record
Audit finding
Sludge handling
Hazardous waste breach
Monitoring frequency
Unexplained excursions
Reporting accuracy
Enforcement risk
Emergency plan
Uncontrolled discharge
A factory that cannot produce twelve months of effluent sampling records does not have an environmental programme, it has an environmental intention.
Where Energy Is Used in Bag Production
Energy in a bag plant is dominated by a small number of loads. Sewing machines are numerous but individually small, while compressed air, lighting, and any steam or chilling system carry a disproportionate share.
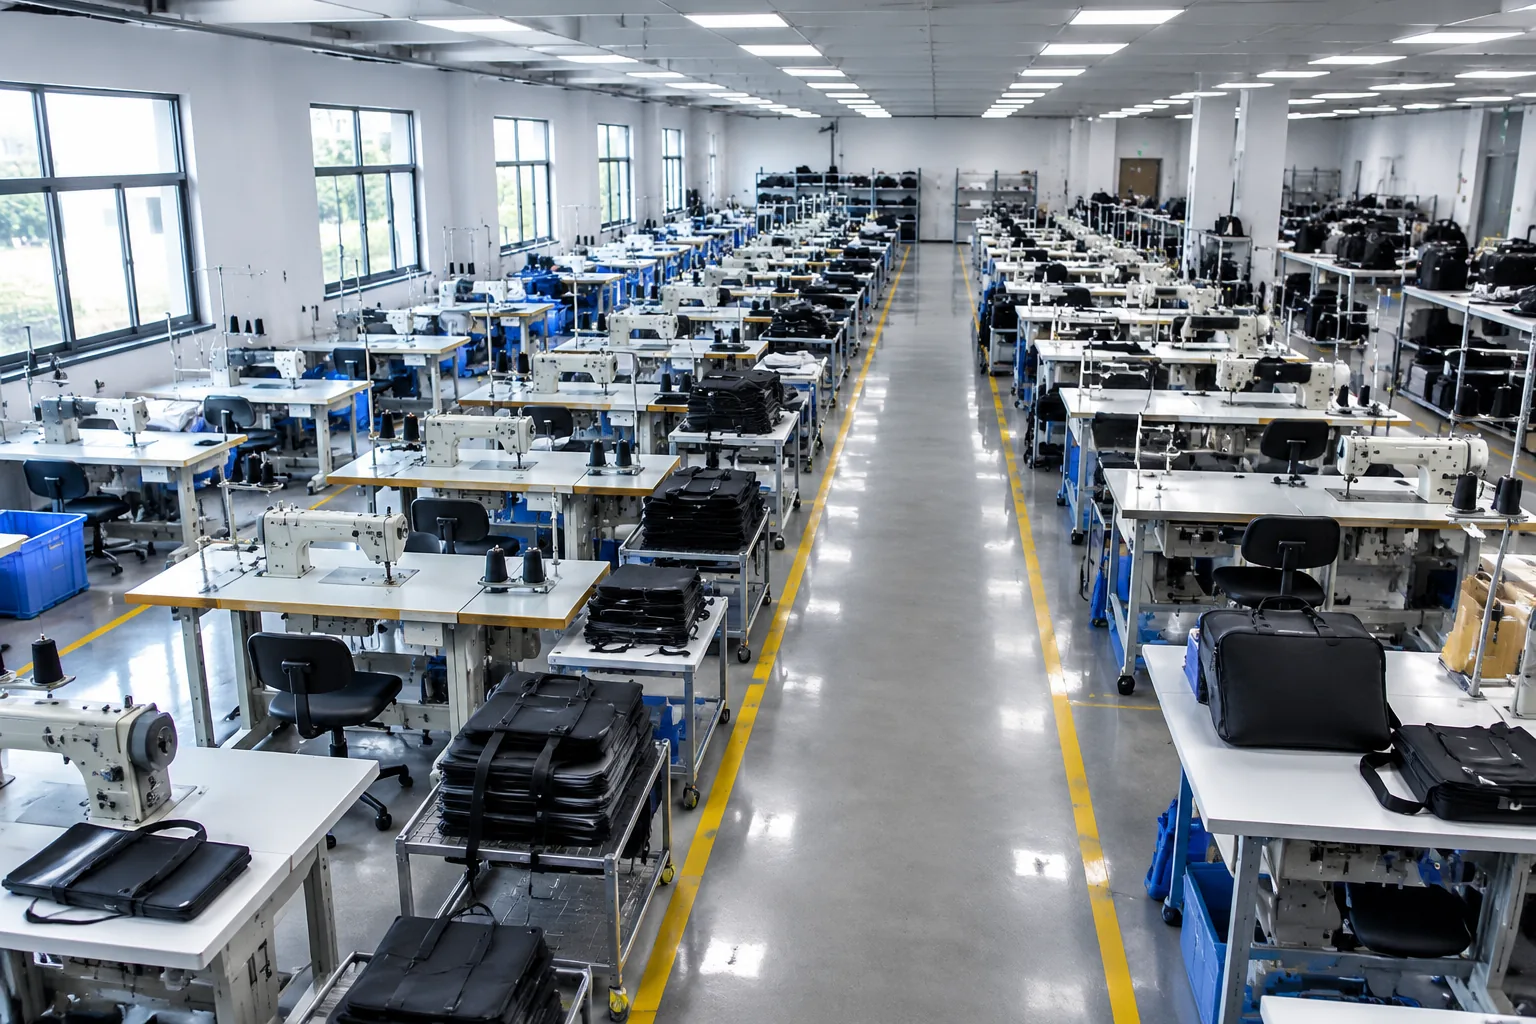
Long rows of industrial sewing machines on a bag factory floor under bright LED panel lighting
The Load Table
Load
Character
Sewing motors
Many small unit loads
Compressed air
Central, leak-prone
Lighting
Large, constant
Ventilation and cooling
Seasonal, significant
Cutting equipment
Intermittent, high draw
Steam or hot water
Process and comfort
The Consumption Split Table
Category
Typical behaviour
Motors
Part-load inefficiency
Air
Leaks and oversupply
Lighting
Left on when idle
Cooling
Oversized and uncontrolled
Hot water
Distribution losses
Standby
Night and weekend load
The Inefficiency Table
Inefficiency
Signature
Idle running
Energy with no output
Air leak
Compressor never unloads
Oversized motor
Low load factor
Uninsulated pipe
Heat loss along the run
Open door
Cooling load rises
Old lighting
High watt per lumen
A compressed air system that never fully unloads is telling you it is leaking, and the leak is costing more than the compressor’s efficiency rating.
The Load Factor Table
Factor
Meaning
Connected load
Total installed capacity
Peak demand
Highest simultaneous draw
Base load
Minimum continuous draw
Load factor
Average against peak
Idle ratio
Time running without output
Specific energy
kWh per unit produced
Energy Reduction Measures
The sequence is the same as for water: eliminate waste before buying equipment. Idle time, leaks, and unnecessary lighting are free to fix and often deliver more than a capital project.
The Energy Measure Table
Measure
Cost
Effect
Leak survey and repair
Low
Cuts compressor run time
Idle-stop on motors
Low
Removes no-load running
Lighting upgrade to LED
Medium
Large, predictable saving
Occupancy and daylight control
Low
Removes lighting waste
Pipe and valve insulation
Medium
Cuts distribution loss
Air pressure reduction
Low
Reduces artificial demand
Heat recovery from compressor
Medium
Free hot water
High-efficiency motors
High
Long-run efficiency gain
The Payback Table
Measure
Payback character
Leak repair
Weeks
Idle-stop
Weeks
Lighting control
Months
LED retrofit
Months to two years
Insulation
One to two years
Heat recovery
One to three years
Compressor replacement
Multi-year
The Quick Win Table
Win
Why it is overlooked
Switching off at breaks
No one is accountable
Closing doors
Comfort beats discipline
Fixing one large leak
Invisible without a survey
Lowering air pressure
Assumed to be fixed
Cleaning filters
Deferred maintenance
Scheduling compressed air
Left running overnight
The finance case for a utility programme is strongest at the beginning, because the first measures cost almost nothing and the last cost a great deal.
The Capital Table
Investment
Justification
Submetering
Makes every later saving provable
LED retrofit
High certainty, fast payback
Compressor controls
Removes part-load loss
Heat recovery
Displaces purchased heat
High-efficiency motors
Long operating life
Building envelope
Reduces cooling load
The Behaviour Table
Behaviour
Intervention
Machines left running
Shift-end checklist
Lights on in empty rooms
Zone control plus audit
Air used for cleaning
Replace with blowers
Doors propped open
Door closers and signage
Maintenance deferred
Scheduled filter changes
No feedback to staff
Monthly area consumption board
Metering and Monitoring
A reduction programme without metering is a set of opinions. Metering converts the utility bill into a map, and the map is what allows a factory to attribute consumption, verify a saving, and defend a number to a buyer.
A technician reading a digital utility submeter on a wall panel in a neat electrical room
The Metering Level Table
Level
Purpose
Main utility meter
Billing and baseline
Area submeter
Attribution by department
Machine meter
Specific consumption
Run-hour counter
Idle time visibility
Air flow meter
Leak and demand tracking
Water meter per line
Use point control
The Data Table
Data
Use
Daily reading
Early anomaly detection
Weekly trend
Drift identification
Monthly report
Management review
Per-unit intensity
Comparison across orders
Run hours
Idle ratio calculation
Alarms
Immediate response
The Verification Table
Question
Evidence
Did consumption fall?
Before and after readings
Was it the measure?
Comparable production volume
Is it sustained?
Twelve-month trend
Is it attributable?
Area-level metering
Is it defensible?
Documented method
Is it reportable?
Auditable records
Targets, Baselines and Reporting
A baseline is the number every later claim is measured against, and a badly built baseline destroys the credibility of the whole programme. The common failure is a baseline drawn from a period that was not representative, so the first reported saving is really a comparison between two different production volumes.
The Baseline Table
Element
Requirement
Period
Twelve consecutive months
Boundary
Stated scope of site and processes
Normalisation
Per unit or per metre produced
Data source
Metered, not estimated
Exclusions
Documented and justified
Approval
Signed by operations and finance
The Intensity Table
Metric
Denominator
Electricity intensity
kWh per thousand units
Water intensity
Cubic metres per thousand units
Thermal intensity
kWh or tonnes of steam per unit
Air intensity
Cubic metres per unit
Waste intensity
Kilograms per thousand units
Cost intensity
Currency per unit
The Target Table
Horizon
Target character
Immediate
Leaks and idle time removed
One year
Metering and quick wins
Three years
Capital measures
Five years
Technology replacement
Ongoing
Intensity reduction per unit
The Reporting Table
Audience
Content
Internal operations
Area consumption and anomalies
Finance
Cost and payback
Buyer
Intensity and progress against target
Auditor
Records and method
Regulator
Permits and sampling
Public
Aggregate and methodology
A buyer asking for a water or energy figure is usually testing whether the factory can produce a defensible number at all, not whether the number is impressive.
The Claim Table
Claim
What it requires
Reduced consumption
Metered before and after
Percentage saving
Normalised baseline
Renewable share
Certificates or contracts
Recycled water share
Metered volumes
Carbon reduction
Emission factor and scope
Certification
Third-party audit
The Review Table
Frequency
Agenda
Daily
Anomaly check against expectation
Weekly
Area consumption and leaks
Monthly
Target against actual
Quarterly
Measure progress and payback
Annual
Baseline review and target reset
Per order
Intensity comparison across styles
A review that only looks at the monthly bill will always lag the problem by a month, which is why the daily anomaly check matters more than the annual report.
Sequencing a Three-Year Programme
The order in which measures are taken matters more than the total ambition, because early low-cost wins fund the credibility and the data that later capital spending depends on.
The Sequence Table
Year
Focus
First
Metering, leaks, idle time, discipline
Second
Lighting, insulation, controls, practice
Third
Heat recovery, reuse plant, equipment replacement
The Milestone Table
Milestone
Evidence
Baseline approved
Signed document
Submeters live
Area data flowing
First saving verified
Before and after readings
Targets set
Approved intensity figures
Buyer report issued
Consented format
Programme reviewed
Annual management review
A factory that installs metering in year one and capital equipment in year three will outperform one that reverses the order, because the second factory cannot prove what its equipment achieved.
The Utility Reduction Checklist
Water
Item
Done
All water use points listed
☐
Submeters installed by area
☐
Leak survey completed
☐
Trigger nozzles fitted
☐
Cleaning practice documented
☐
Counterflow rinsing in place
☐
Open cooling loops closed
☐
Condensate recovery evaluated
☐
Energy
Item
Done
Load inventory completed
☐
Submetering by area
☐
Compressed air leak survey
☐
Idle-stop configured
☐
Lighting upgraded or controlled
☐
Pipe insulation verified
☐
Air pressure optimised
☐
Heat recovery assessed
☐
Management
Item
Done
Baseline built and approved
☐
Intensity metrics defined
☐
Owner assigned per area
☐
Monthly review scheduled
☐
Target approved by management
☐
Records retained twelve months
☐
Buyer reporting format agreed
☐
Next measures prioritised
☐
Cooling, Ventilation and the Building
In a plant located in a hot climate, cooling and ventilation can exceed the sewing floor in energy terms, and the load is driven as much by the building as by the machines. This is the area where the cheapest measures are structural rather than technical.
The Cooling Table
Source of load
Control
Solar gain through roof
Insulation or reflective coating
Open doors and shutters
Air locks and discipline
Machine heat
Local extraction
Lighting heat
Efficient fixtures
Occupancy
Zoning by area
Ventilation excess
Demand-based control
The Building Table
Measure
Effect
Roof insulation
Cuts solar gain
Reflective coating
Lowers surface temperature
Roof ventilation
Removes trapped heat
Partitioning
Cools only occupied zones
Door control
Prevents infiltration
Ceiling fans
Allows higher set point
The Set Point Table
Setting
Consequence
Lower than needed
Energy with no benefit
Fixed all year
Waste in mild seasons
No zoning
Whole plant cooled
No night setback
Load carried when idle
Uncalibrated sensors
Wrong control decisions
No maintenance
Efficiency decay
Every degree of cooling set point that is not actually required is paid for on every operating hour of the year.
Investment Appraisal and Payback
Utility measures compete for the same capital as machines that make bags, and they usually lose because the benefit is spread across a bill rather than attached to an order. A simple appraisal method removes that disadvantage by putting every measure on the same basis.
The Appraisal Table
Input
Source
Annual saving
Metered baseline against post-measure
Capital cost
Quotation including installation
Operating cost change
Maintenance and consumables
Measure life
Equipment or practice duration
Payback
Capital divided by annual saving
Risk
Confidence in the saving
The Simple Payback Table
Measure type
Payback character
Leak repair
Under one month
Idle-stop settings
Under one month
Cleaning discipline
Immediate
Lighting controls
Two to six months
LED retrofit
Six months to two years
Heat recovery
One to three years
Effluent reuse plant
Three to six years
The Ranking Table
Criterion
Weighting logic
Payback
Shorter ranks higher
Certainty
Measured beats estimated
Disruption
No shutdown ranks higher
Maintenance burden
Lower ranks higher
Compliance value
Permit risk ranks higher
Buyer value
Requested evidence ranks higher
A programme that ranks measures by payback alone will fix the easy things and stop, so the ranking should also carry certainty and compliance value.
The Financing Table
Route
Character
Operating budget
Fast, small measures
Capital budget
Slower, larger measures
Utility incentive
Reduces capital cost
Performance contract
Shared saving, longer term
Buyer co-investment
Tied to programme requirements
Lease
Preserves cash, higher total cost
Working With Buyers and Audits
Utility data has become part of the supplier questionnaire, and the questions are usually asked by people who will check the answer against a later audit. A factory that answers with a total and no method is exposed at the first site visit.
The Question Table
Buyer question
What it really tests
What is your annual energy use?
Whether metering exists
Per unit or total?
Whether normalisation is understood
What is your water source?
Whether the boundary is known
How is effluent treated?
Whether permits are held
What have you reduced?
Whether a baseline exists
Can you evidence it?
Whether records are retained
The Evidence Table
Evidence
Format
Utility bills
Twelve consecutive months
Submeter logs
Area and machine level
Baseline document
Approved and dated
Measure register
Description and date
Effluent sampling
Lab reports and permits
Verification report
Internal or third party
The Audit Table
Audit focus
Preparation
Metering presence
Physical inspection
Records
Retrievable within a day
Permit currency
Valid and displayed
Effluent quality
Sampling history
Worker knowledge
Operators can explain practice
Improvement claim
Traceable to data
An auditor who finds a meter that is not read has found something more damaging than no meter at all, because it shows the programme was installed rather than operated.
The Response Table
Situation
Sound response
Data not yet available
State the plan and the date
Measure only partly implemented
Describe the stage
Baseline built recently
Disclose the start date
Claim depends on certificates
Show the certificates
Non-compliance found
Disclose and correct
Figure disputed
Share the method
Extending the Programme to Subcontractors
Most bag factories do not make every component in-house. Cutting, printing, embroidery, metal finishing, and sometimes assembly are placed with subcontractors, and a utility programme that stops at the factory gate reports a boundary that does not match the product.
The Subcontract Table
Process
Utility character
Printing
Solvent and heat
Embroidery
Many small motors
Metal finishing
Plating water and effluent
Cutting
Intermittent high draw
Assembly
Lighting and air
Packaging
Heat and compressed air
The Engagement Table
Level
Requirement
Awareness
Subcontractor knows the policy
Declaration
States consumption and source
Metering
Provides area data
Target
Commits to an intensity reduction
Verification
Accepts audit access
Reporting
Submits data on schedule
The practical test of a supply chain claim is whether the factory can name the subcontractors inside its stated boundary, and whether it has data from them rather than assurances.
The Risk Table
Risk
Consequence
Boundary not stated
Claim overstated
Data estimated
Figure not defensible
Small workshops
No metering at all
Single process outsourced
Load invisible
No audit access
Unverified assurance
Frequent switching
Data continuity lost
The Boundary Table
Boundary option
Character
Site only
Simplest, narrowest
Site plus captive units
Common in practice
All subcontractors
Broadest, hardest to evidence
Tier one only
Manageable, incomplete
Material plus process
Aligned with product carbon
Operational control
Aligned with management authority
Common Programme Failures
Most utility programmes do not fail because the measures were wrong. They fail because the programme had no owner, no measurement, or no connection to the way the factory already makes decisions.
The Failure Table
Failure
Early signal
No owner
Meetings with no decisions
Baseline unclear
Savings disputed
Metering skipped
Consumption cannot be attributed
Capital-first approach
Large spend, modest result
One-off project
Consumption drifts back
No operator involvement
Measures reversed on the floor
Reporting mismatch
Buyer questions unanswered
Targets not normalised
Apparent saving from lower output
The Governance Table
Role
Responsibility
Plant manager
Owns the target
Maintenance
Leaks, insulation, settings
Production supervisor
Idle time and lighting discipline
Utilities engineer
Metering and data
Finance
Payback and verification
Quality
Records and audit readiness
A programme with a target and no owner is a poster. A programme with an owner and a meter is a process.
The Reversal Table
Measure
How it gets undone
Idle-stop
Disabled for convenience
Pressure reduction
Turned back up to fix a symptom
Lighting control
Overridden manually
Cleaning discipline
Reverts under schedule pressure
Leak repair
New leaks ignored
Insulation
Removed for maintenance and not replaced
FAQ
Where should a bag factory start if it has never measured utilities?
Start with a twelve-month bill history and a walk-round, because the bill establishes the annual total and the walk-round identifies the obvious losses. Then install submeters on the four or five largest areas, which in most bag plants are compressed air, lighting, ventilation or cooling, and the sewing floor as a group. Do not attempt machine-level metering first; the cost is high and the attribution question is not yet precise enough to justify it. With area data in hand, fix leaks and idle time, because those measures require almost no capital and produce a visible change in the next billing period, which builds the credibility needed for later investment.
Is water reduction relevant for a factory that does not dye or finish fabric?
It is smaller in scale but still worth attention, because the water that is used tends to be used inefficiently. Boiler makeup, cooling, floor and equipment cleaning, and sample washing are the main points. The largest easily controlled use is usually cleaning, where a hose left running can consume more in a shift than a controlled bucket wash consumes in a week. Closing once-through cooling loops, recovering condensate, and fitting trigger nozzles are low-cost measures with short paybacks. A factory that reduces water also reduces the effluent it must treat, so the saving appears twice.
How large is the energy saving from fixing compressed air leaks?
It depends on the leak load, but leaks are frequently the single largest avoidable loss in a plant that uses air for cleaning, clamping, or tools. A system that never unloads is usually leaking enough to keep the compressor at full output during periods of low production. The saving is measured by run hours rather than by a calculation: if the compressor runs eight hours a day when production needs five, the difference is the leak and the oversupply together. A leak survey with tagging and repair, followed by a repeat survey, is the standard method, and the repeat survey is what prevents the saving from decaying.
Should a factory replace motors or fix the system first?
Fix the system first, almost always. A high-efficiency motor on an oversized, poorly controlled, leaky system delivers a small fraction of the saving that the same money would produce by correcting the system. The sequence should be: eliminate leaks and unnecessary demand, reduce pressure to the minimum the equipment requires, add controls so the supply matches demand, and only then consider motor replacement for the remaining continuous loads. A factory that replaces motors without addressing demand will find the new motors running at the same part load as the old ones, with a payback measured in decades rather than years.
What is a defensible baseline for a buyer-facing claim?
It should cover twelve consecutive months, state the boundary explicitly, be normalised per unit or per metre produced, and be built from metered data rather than estimates. The period should be representative of normal production, and any unusual events should be documented rather than smoothed away. The normalisation matters most: a factory that reduced output by a third and reports a third less energy has not saved anything. A baseline approved by operations and finance before the programme begins is far more defensible than one reconstructed afterwards, because the reconstruction is always open to the accusation that it was chosen to flatter the result.
How do we keep savings from eroding after the project ends?
By making the measure part of the standard work rather than a project deliverable. That means the setting is written into the machine parameter sheet, the leak survey is a scheduled task, the cleaning method is in the operator instruction, and the area consumption is reviewed monthly against a target. The most common erosion pattern is a control that gets disabled because it caused an inconvenience, so the reason for each setting should be documented and the override should require authorisation. A monthly review with a named owner is what turns a one-time saving into a maintained condition.
What should a factory report to a buyer who asks about water and energy?
Report intensity rather than totals, state the boundary and the baseline period, and describe the measures rather than only the percentage. A buyer is usually trying to establish whether the factory can produce a defensible number, so the method matters as much as the result. Where a claim depends on renewable electricity certificates or purchased offsets, say so explicitly and keep the evidence, because a claim that cannot be substantiated is worse than no claim. It is also reasonable to disclose what has not yet been measured, which signals that the programme is real rather than assembled for the questionnaire.
Does a utility programme conflict with cost pressure on unit price?
Not when the measures are sequenced properly. Leak repair, idle-stop, lighting control, and cleaning discipline reduce cost without affecting output or quality, so they are compatible with price pressure by definition. The conflict appears when a factory buys capital equipment before fixing free losses, because the capital charge then competes with margin. Utilities are also one of the few cost lines a factory controls entirely, since fabric and hardware prices are set by the market. A plant that can quote a lower utility cost per unit has a genuine structural advantage rather than a temporary concession.
Conclusion
Water and energy reduction in a bag factory is not an environmental gesture bolted onto production. It is a cost programme that happens to have an environmental result, and it responds to the same disciplines as any other cost programme: measure it, attribute it, fix the free losses first, and verify the result against a normalised baseline.
The starting point is unglamorous. Read twelve months of bills, walk the plant, list the use points, install a handful of submeters, and repair the leaks that the survey finds. That sequence costs little, produces a visible change within a billing cycle, and creates the data on which every later decision depends.
From there the programme becomes a schedule rather than a project. Lighting is upgraded and controlled, compressed air pressure is reduced and its demand matched to production, open water loops are closed, condensate is recovered, and idle time is designed out of the machines. Each measure has a payback, and each payback is only credible if the metering exists to prove it.
The governance matters as much as the engineering. A named owner per area, a monthly review against an intensity target, and records retained for a year turn a set of measures into a maintained condition. Without that structure, savings decay quietly as controls are overridden and leaks return.
For buyers, the practical questions are whether the factory can state its boundary, its baseline period, and its intensity metric, and whether it can show the measures behind the number. A supplier who can answer those three is managing utilities. A supplier who answers with a total and no method is repeating a figure it does not control.
For factories, the return is a cost line that competitors treat as fixed. Fabric and hardware prices are set by the market, labour is set by the region, but utility cost per unit is set by the plant itself, and it is one of the few places where a well-run factory can build a durable advantage over a larger one.