
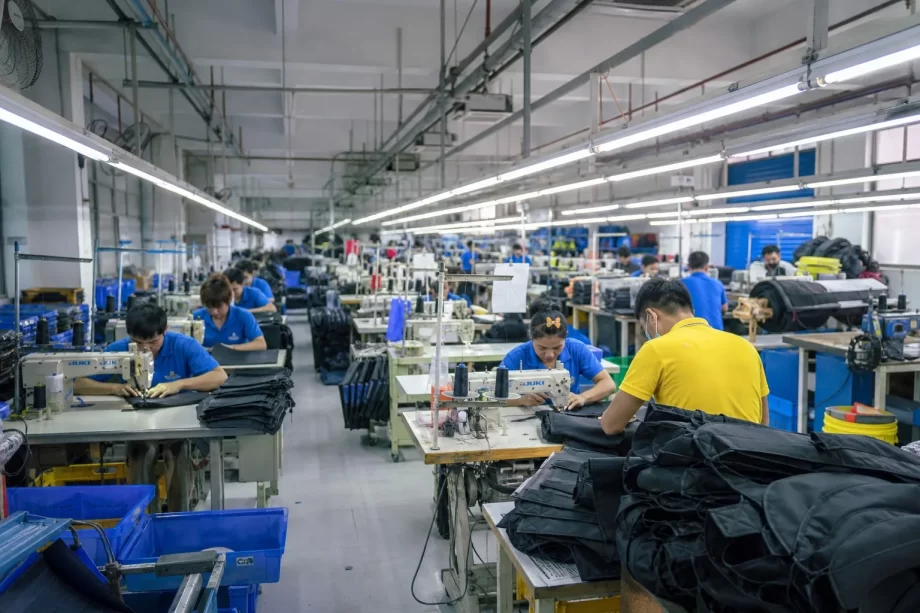
Backpack Factory Capacity Planning: Output and Lead Times
Every missed delivery date starts the same way: a factory promised a lead time without actually knowing its capacity. The salesperson quoted four weeks because that is what the market expects. The production manager looked at the schedule and said nothing. The order landed in a line that was already overloaded, and the container slipped by a month. The buyer lost the season, and the factory lost the reorder.
Capacity planning is the discipline that prevents this. It answers three questions with numbers instead of hopes: how much can this factory actually produce? How long will this specific order really take? And what needs to change — staffing, scheduling, or promises — to make the delivery date real?
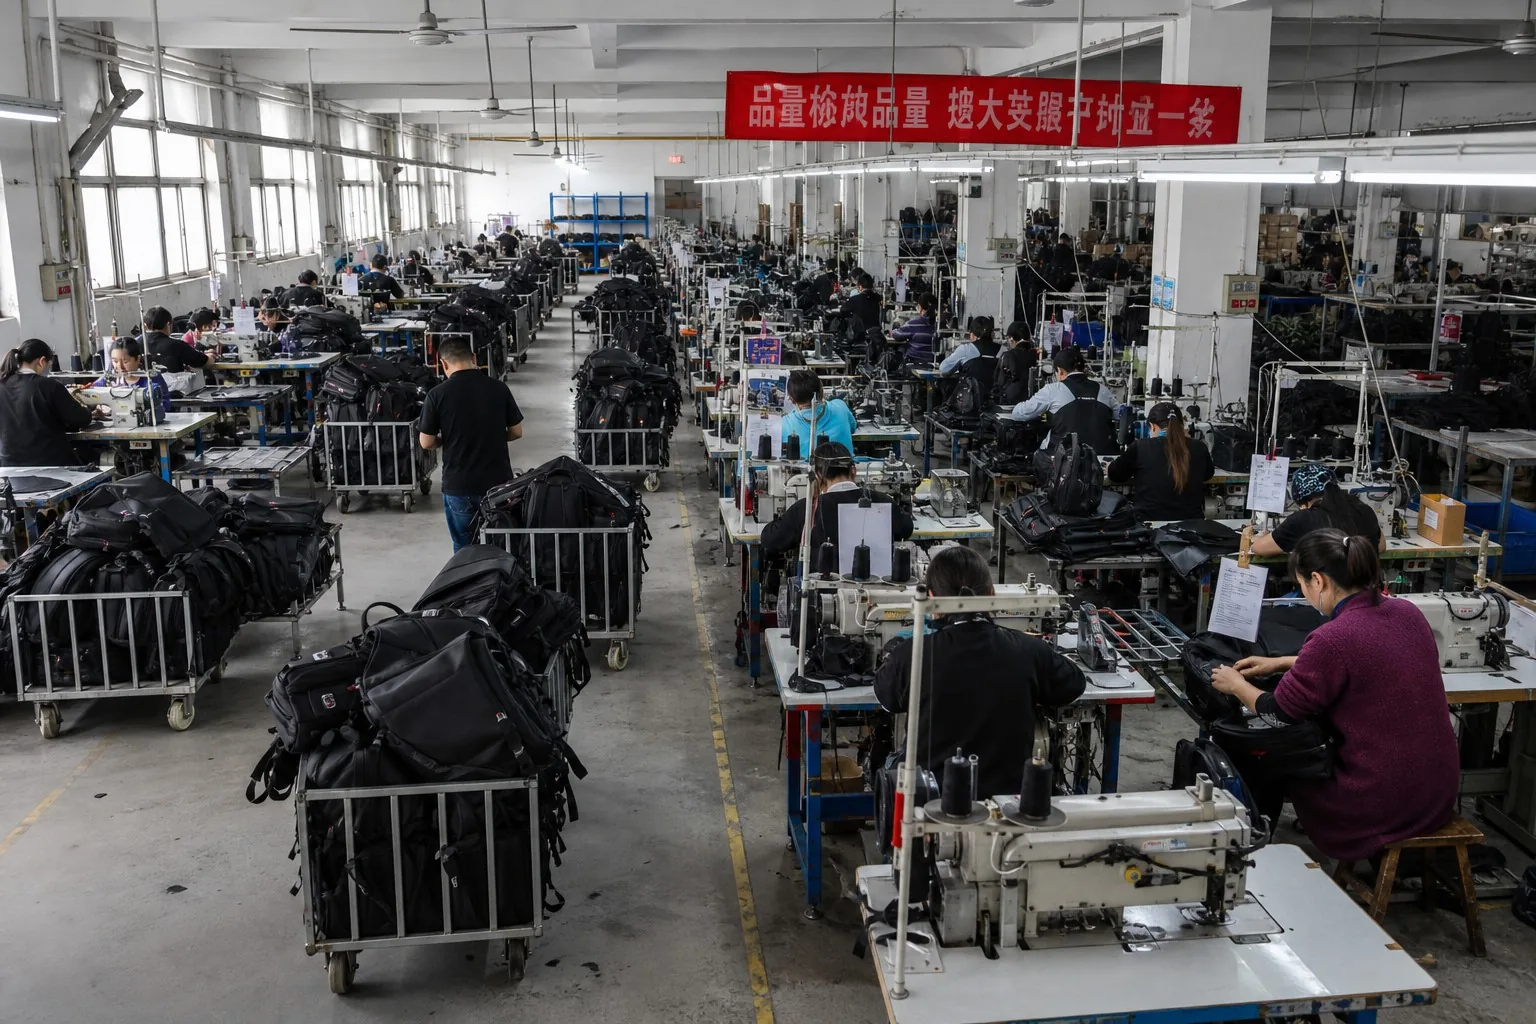
This guide explains backpack factory capacity planning from the inside: the basic capacity math every factory should run, how to measure standard time and line efficiency, the production line models (single-piece flow vs batch, dedicated vs mixed lines), staffing and training implications, scheduling methods that handle bottlenecks, how to calculate honest lead-time commitments, and the capacity traps that cause most late shipments.
- Why Capacity Planning Decides Everything
- The Core Capacity Math
- The Production Line Models
- Staffing: The Real Constraint
- Scheduling: Making the Plan Real
- Managing the Bottlenecks
- Honest Lead-Time Commitments
- The Capacity Traps That Cause Late Shipments
- Communicating Capacity to Buyers
- Scaling Up: Growing Capacity Safely
- Capacity by Product Type: The SAM Differences
- Peak Season and Capacity Flexibility
- Capacity-Driven Quoting and Pricing
- Monitoring Capacity: The Daily Scoreboard
- The Buyer’s Role in Capacity Success
- The Capacity Reality Check
- FAQ
- Conclusion
Why Capacity Planning Decides Everything
Capacity planning is not a back-office exercise. It directly controls three outcomes buyers care about most:
| Outcome | Driven by | Failure symptom |
|---|---|---|
| Delivery reliability | Honest capacity math | Missed containers, lost seasons |
| Price stability | Realistic costing | Rush surcharges, overtime costs |
| Quality consistency | Balanced lines | Rushed work, defect spikes |
| Reorder confidence | Proven track record | Buyers move to other factories |
| Growth capacity | Planned scaling | Overbooking, burned relationships |
Manufacturer’s note: The factories that quote the most reliable lead times are not the most optimistic — they are the most honest. They know their real output per line, per day, and they quote from data, not hope. Buyers remember the factory that delivered on time far longer than the factory that quoted the shortest lead time.
The Core Capacity Math
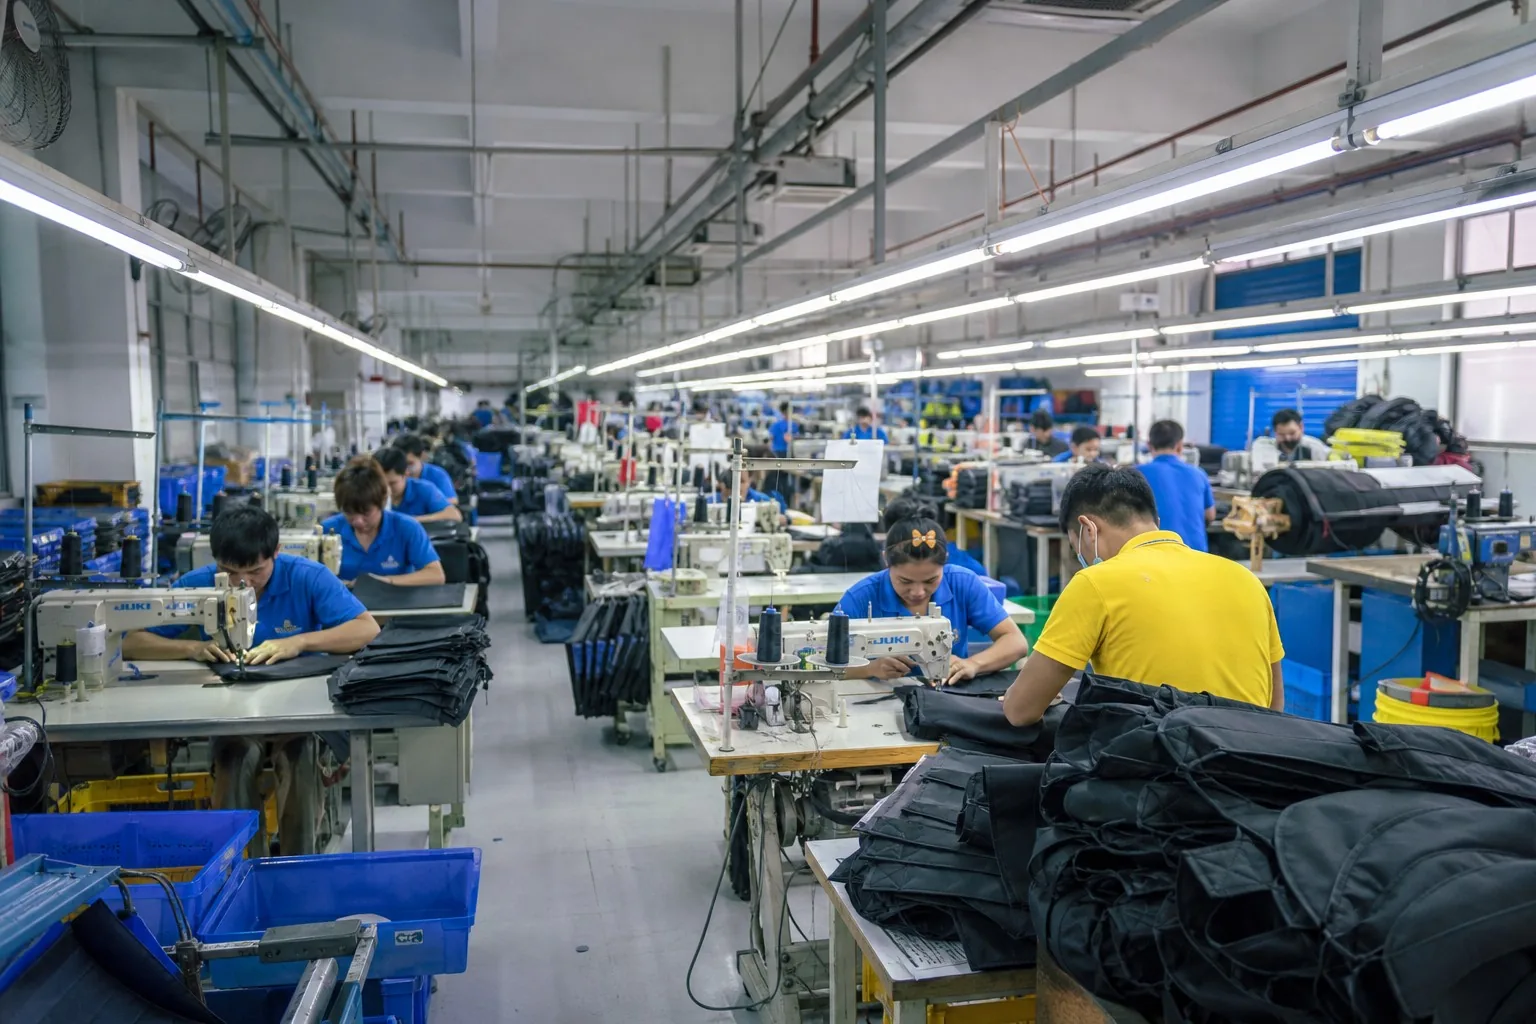
Capacity planning starts with three numbers: standard time, efficiency, and available hours. Everything else derives from these.
Standard Time (SAM)
Standard Allowed Minutes (SAM) is the time a trained operator takes to complete one operation, measured and averaged under normal conditions. For a typical backpack:
| Operation | SAM (minutes, typical) |
|---|---|
| Cutting a panel set | 2–5 |
| Sewing a pocket | 1.5–3 |
| Zipper installation | 2–4 |
| Main body assembly | 5–10 |
| Lining assembly | 4–8 |
| Straps and handles | 3–6 |
| Final assembly and finishing | 5–10 |
| Total SAM (typical 25 L pack) | 25–45 minutes |
Efficiency
Efficiency is actual output vs theoretical output, expressed as a percentage:
- Theoretical: operator works every minute at standard pace.
- Realistic: operators take breaks, handle material, change thread, fix issues — 70–85% is typical for a well-run line.
The Daily Capacity Formula
Daily output = (Available minutes per line × efficiency) ÷ SAM
Example calculation:
| Variable | Value |
|---|---|
| Operators per line | 30 |
| Working minutes per day | 480 (8 hours) |
| Efficiency | 80% |
| Effective minutes | 30 × 480 × 0.80 = 11,520 |
| SAM per pack | 32 minutes |
| Daily output | 11,520 ÷ 32 = 360 packs/day |
The Monthly Picture
| Line scale | Daily output (32-min pack) | Monthly output (24 working days) |
|---|---|---|
| 10 operators | 120 | 2,880 |
| 20 operators | 240 | 5,760 |
| 30 operators | 360 | 8,640 |
| 50 operators | 600 | 14,400 |
Manufacturer’s note: The capacity formula is simple, but it only works if the numbers are honest. Factories that quote capacity at 100% efficiency, or that count every operator as producing the standard pack, are building schedules on fiction. The 80% efficiency rule and the real SAM for the real design are the difference between a schedule and a promise.
The Production Line Models
How the line is organized changes capacity, flexibility, and quality.
Single-Piece Flow vs Batch
| Model | How it works | Pros | Cons |
|---|---|---|---|
| Single-piece flow | Each pack moves through operations one at a time | Short lead time per unit, quick defect detection | Needs balanced stations, skilled multi-taskers |
| Batch flow | Batches of packs move together (e.g., 50 at a time) | Simpler training, fewer machine changes | Longer per-unit time, defects found late |
Most backpack factories run a hybrid: batches within stations, flow between major operations.
Dedicated vs Mixed Lines
| Model | Best for | Capacity behavior |
|---|---|---|
| Dedicated line | One product, long runs | Predictable output, simple scheduling |
| Mixed line | Multiple styles, smaller runs | Flexible but slower per style (changeover time) |
| Changeover factor | Impact |
|---|---|
| Style change (same materials) | 0.5–1 day lost |
| Material change | 1–2 days (re-setup, new training) |
| Full new product | 2–4 days (patterns, training, first pieces) |
Staffing: The Real Constraint
Machines are easier to add than skilled operators. Staffing is usually the true capacity ceiling.
The Staffing Pyramid
| Role | Function | Training time |
|---|---|---|
| Cutting operators | Fabric cutting, marker following | 1–3 months |
| Sewing operators | Main sewing operations | 3–6 months to full speed |
| Specialized sewers | Bar-tack, binding, heavy fabric | 6–12 months |
| Quality inspectors | In-line and final checks | 1–3 months |
| Supervisors | Line management, balancing | Years of experience |
The Turnover Reality
| Factor | Impact on capacity |
|---|---|
| Annual operator turnover (typical 10–30%) | Continuous retraining drags efficiency |
| New operator ramp | 60–80% speed for the first 1–3 months |
| Peak season labor | Higher wages, higher turnover, quality risk |
The Staffing Plan
- Build a buffer — plan 5–10% more headcount than the bare requirement.
- Cross-train — operators who can do two or three operations smooth bottlenecks.
- Plan training — new operators on simple operations first; complex operations need experienced hands.
Manufacturer’s note: The question buyers should ask is not “how many operators do you have?” but “how many experienced operators do you have on this product type?” A line of 30 with 10 new operators produces less than a line of 25 experienced ones — and the quality is different too.
Scheduling: Making the Plan Real
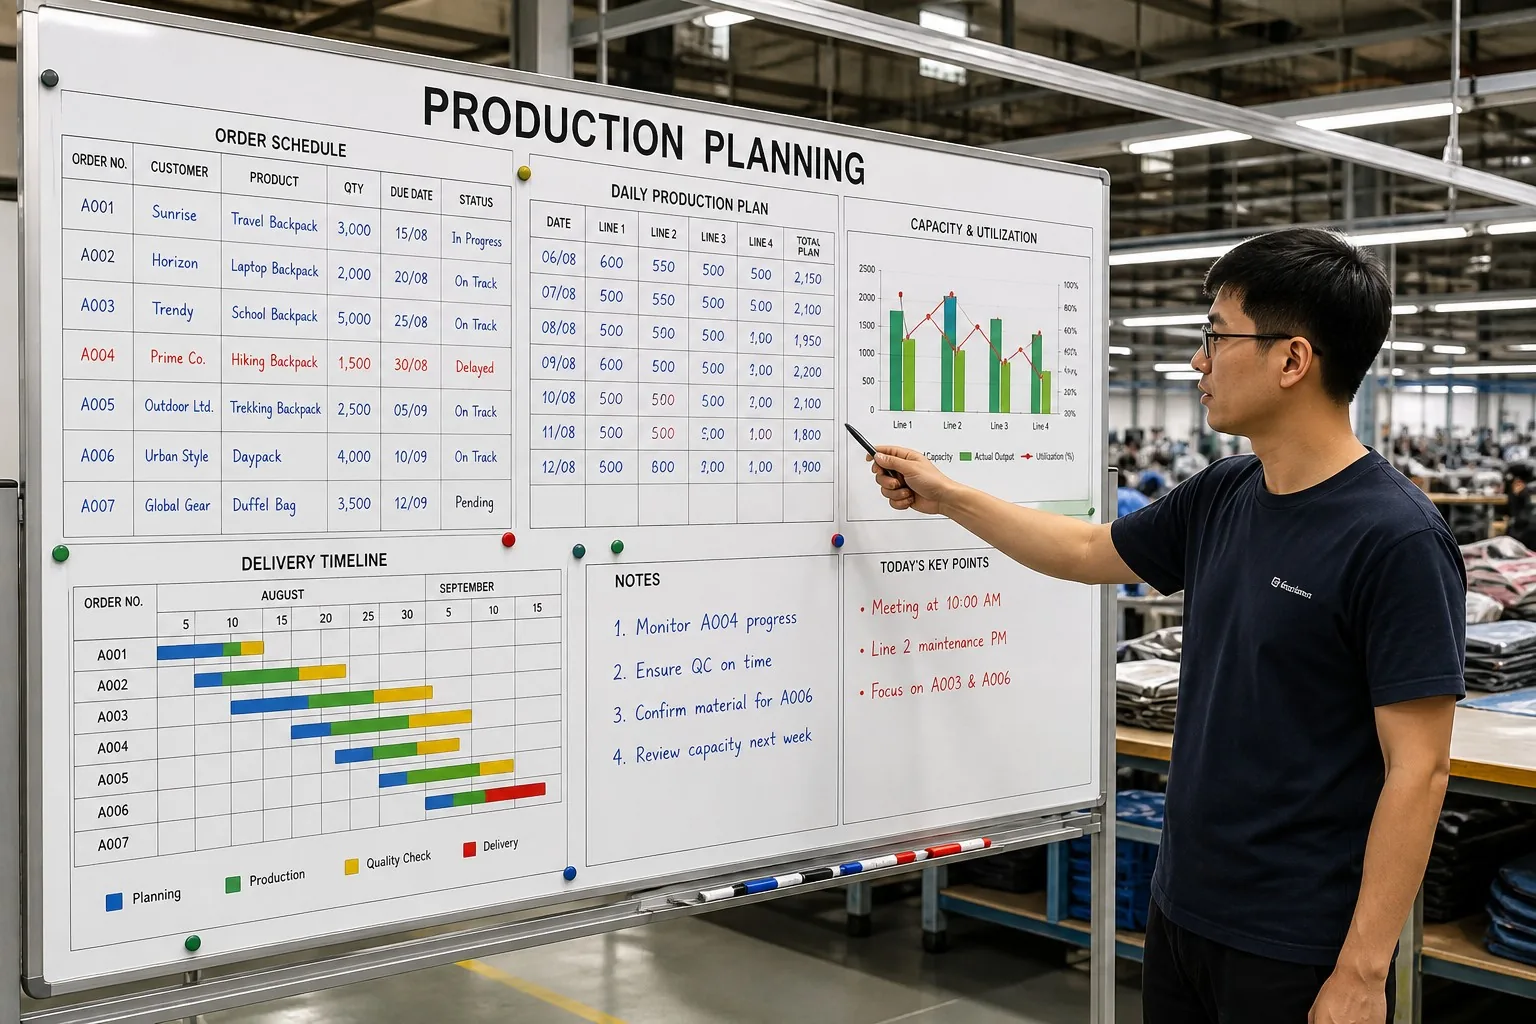
Scheduling turns capacity numbers into a calendar. The methods matter less than the discipline.
The Scheduling Approaches
| Method | How it works | Best for |
|---|---|---|
| Forward scheduling | Start now, work forward | Available capacity, normal orders |
| Backward scheduling | From delivery date, work back | Fixed deadlines, launches |
| Bottleneck-based | Schedule the constraint first | Multi-product factories |
The Scheduling Checklist
- Confirm materials arrive before the production slot (material lead time is often longer than production).
- Allocate cutting capacity first — cutting is often the hidden bottleneck.
- Sequence styles to minimize changeovers (same fabric/color together).
- Protect the launch-date orders with buffer.
- Review the schedule weekly against actual output.
The Weekly Review
| Metric | What it reveals |
|---|---|
| Planned vs actual output | Efficiency drift |
| Bottleneck queue length | Constraint location |
| Changeover time share | Scheduling efficiency |
| Rework rate | Quality pressure |
| Delivery on-time rate | The scoreboard |
Managing the Bottlenecks
Every factory has a bottleneck — the operation that limits the whole line. Finding and managing it is the heart of capacity planning.
The Common Bottlenecks in Backpack Production
| Operation | Why it bottlenecks | Relief |
|---|---|---|
| Cutting | Pattern complexity, material direction | Dedicated cutting team, better nesting |
| Bar-tack | Specialized machine, operator | Second machine, trained backup |
| Binding | Machine-dependent | Spare machines, preventive maintenance |
| Final assembly | Most complex, most skills | Experienced team, balanced workload |
| Packing/QC | End-of-line surge | Inspection scheduled ahead of packing |
The Bottleneck Rules
- Never let the bottleneck wait — feed it continuously.
- Protect bottleneck quality — defective work fed to a bottleneck is the worst waste.
- Measure the bottleneck — its output IS the line’s output.
- Improve the bottleneck first — one hour saved there is an hour saved for the whole line.
Honest Lead-Time Commitments
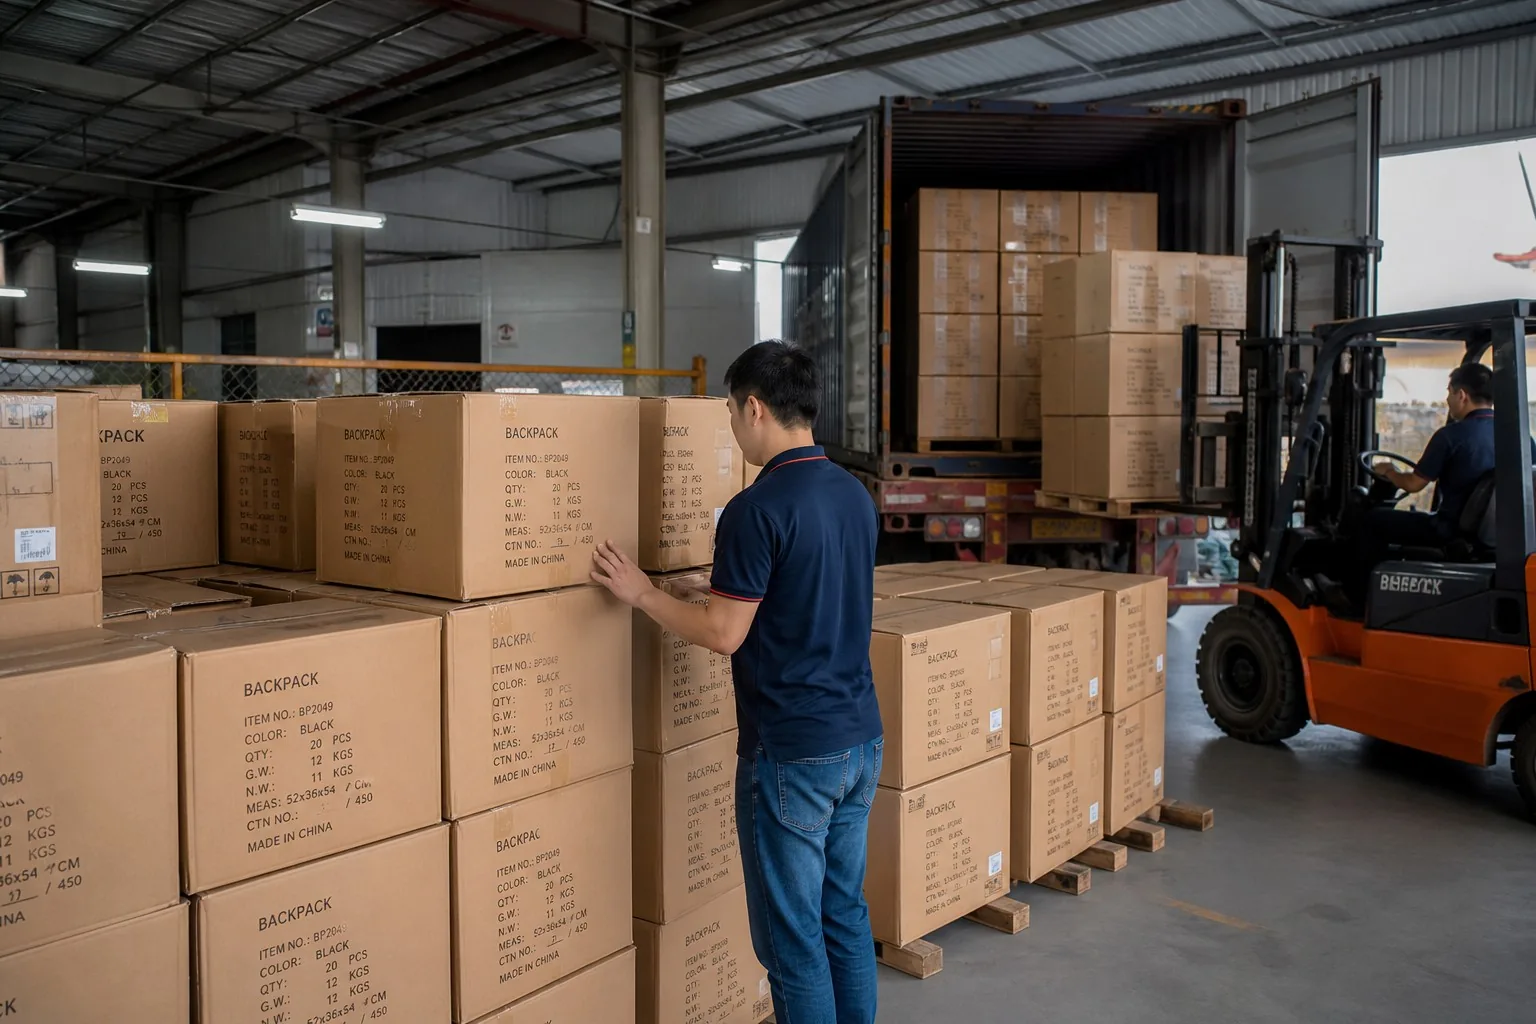
The lead time is the buyer-facing output of all this planning. Honest lead times are built, not guessed.
The Lead Time Building Blocks
| Stage | Typical duration | Controllable |
|---|---|---|
| Pattern and sample approval | 2–4 weeks | Both |
| Material procurement | 2–6 weeks | Factory/market |
| Production | 2–6 weeks | Factory |
| QC and packing | 3–7 days | Factory |
| Total (typical) | 8–16 weeks | — |
The Buffer Rules
| Factor | Recommended buffer |
|---|---|
| Material delays | 1–2 weeks in the schedule |
| Line congestion | 1–2 weeks in peak season |
| New product first run | +20–30% production time |
| QC rework allowance | 3–5% of production time |
| Quoted lead time | = realistic plan + explicit buffer |
What Buyers Should Ask About Lead Times
- “Is this lead time based on current line loading?” — the answer reveals if the quote is real.
- “What is your current capacity utilization?” — 90%+ utilization means delays are likely.
- “What happens if materials arrive late?” — the plan for slippage.
- “Can you show me your last three orders’ on-time rate?” — the scoreboard never lies.
Manufacturer’s note: A factory that quotes a lead time without asking about your season, your materials, and its own current loading is guessing. A factory that says “we can do it in 6 weeks, but with the current line loading it is safer to quote 8” is planning. Buy the second one — the first one will cost you a season.
The Capacity Traps That Cause Late Shipments
These are the recurring reasons factories miss dates — and how to avoid each:
| Trap | How it happens | Prevention |
|---|---|---|
| Optimistic efficiency | Planning at 100% efficiency | Use 70–85% |
| Overbooking | Sales quotes beyond capacity | Capacity gate before quoting |
| Material blindness | Materials assumed available | Confirm materials before committing |
| Changeover blindness | Style changes not scheduled | Batch same-fabric styles |
| Training lag | New operators counted at full speed | Ramp curves in the plan |
| QC as afterthought | Inspection time not scheduled | Build inspection into the plan |
| Peak-season pressure | All orders compressed | Buffer, realistic promises |
| Rework spiral | Defects push work backward | First-piece checks, in-line QC |
The Capacity Gate
The most powerful anti-trap tool is a capacity gate: no order is quoted until the production manager confirms the line slot exists.
The Gate in Practice
The gate works in five steps, and it works only when it is enforced without exceptions:
- Sales receives the inquiry with design, quantity, and target date.
- Production checks current loading, material availability, and the SAM for the design.
- Production returns a confirmed slot or a counter-proposal with the real date.
- Sales quotes the confirmed slot and the price that slot supports.
- The slot is reserved — a second order cannot silently take it.
The gate fails when sales quotes first and production finds out later. That is not a capacity problem; it is a process problem — and it produces the same missed dates either way. Enforce the order: slot first, quote second.
- Sales request arrives.
- Production checks current loading and material lead time.
- Production confirms or proposes a slot.
- Sales quotes the confirmed slot — not a guess.
Communicating Capacity to Buyers
Transparency about capacity builds trust and prevents disappointment.
What to Share (and What Not to)
| Share | Why |
|---|---|
| Current production window | Buyer can plan its season |
| Material lead times | Buyer can order early |
| Peak-season pressure | Buyer can book early |
| Honest on-time history | Trust-building |
| Capacity limits | Realistic expectations |
| Don’t over-share | Why |
|---|---|
| Raw cost structures | Negotiation disadvantage |
| Exact other clients’ names | Confidentiality |
The Relationship Value
A factory that tells a buyer “we are fully booked for 6 weeks” is not losing the order — it is building a reputation. The buyer who knows the truth can wait, plan, or pay for priority — and returns next season because the factory was honest.

Scaling Up: Growing Capacity Safely
Growth is a capacity question too. Factories that scale well follow a discipline:
The Scaling Path
| Stage | Action |
|---|---|
| 1. Measure | Know current line output per style |
| 2. Add machines | Match machines to bottleneck operations |
| 3. Hire ahead | Train operators before the machines arrive |
| 4. Pilot the line | Run a trial style before committing |
| 5. Ramp gradually | Increase volume in steps, not leaps |
| 6. Monitor quality | Capacity growth must not outpace quality |
The Growth Warning
- Doubling output in a month without doubling trained staff is a quality disaster waiting to happen.
- The safe growth rate for most factories is 15–30% per quarter.
- Faster growth needs new facilities or subcontracting — with its own risks.
The Growth Readiness Questions
Before a factory commits to a big growth order, both sides should verify readiness:
- Can the current line hold quality at 30% more volume?
- Are trained operators available, or will new hires dilute skill?
- Do material suppliers have the capacity for the increased demand?
- Is the management bandwidth there for two lines instead of one?
- What happens to existing orders while the new capacity ramps?
Growth orders are the ones most likely to fail when the answers are guesses. A factory that grows with the same discipline it uses to plan capacity — measured, phased, and monitored — protects the buyer, the order, and its own reputation.
Capacity by Product Type: The SAM Differences
Capacity planning must account for the product itself. Different pack types have very different labor content:
| Product type | Typical SAM range | Relative labor | Capacity per 30-op line/day |
|---|---|---|---|
| Simple school pack | 15–25 min | 1.0× baseline | 460–770 |
| Standard commuter pack | 25–40 min | 1.5× | 290–460 |
| Laptop/tech pack | 30–45 min | 1.8× | 255–385 |
| Travel pack (structured) | 35–55 min | 2.2× | 210–330 |
| Tactical pack (heavy) | 40–70 min | 2.5× | 165–290 |
| Leather pack (specialized) | 45–80 min | 3.0× | 145–255 |
The Planning Implications
- Mix matters — a factory booking tactical packs at school-pack capacity is overbooking by 2–3×.
- SAM must be measured per design — the “standard pack” is a myth; every design has its own labor content.
- First runs run slower — add 20–30% SAM for the first production run of a new design (learning curve).
The Order Sizing Decision
| Order size | Capacity strategy |
|---|---|
| Small (200–500) | Fit into existing line gaps, one line, few weeks |
| Medium (500–2,000) | Dedicated line slot, scheduled window |
| Large (2,000–10,000) | Multiple lines or parallel lines, phasing |
| Very large (10,000+) | Phased batches, dedicated lines, material plan |
Manufacturer’s note: When a buyer asks “can you do 5,000 packs in 4 weeks?”, the factory should ask two questions first: what design (what SAM) and what is the current line loading? Five thousand simple school packs and five thousand structured travel packs are entirely different commitments. The capacity math only works when the product is in the equation.
Peak Season and Capacity Flexibility
Demand in the bag industry is seasonal — school season, holiday gifting, and outdoor seasons create demand spikes that strain capacity.
The Demand Pattern
| Period | Typical demand | Capacity pressure |
|---|---|---|
| January–February | Low | Underutilized |
| March–May | Rising | Moderate |
| June–August | Peak (school + holiday orders) | Extreme |
| September–November | Holiday season | High |
| December | Winding down | Moderate |
The Flexibility Toolkit
| Strategy | How it works | Cost | Risk |
|---|---|---|---|
| Overtime | Extended working hours | Wage premium | Fatigue, quality drift |
| Extra shifts | Second shift on key lines | Higher wages, supervision | Training gaps |
| Temporary labor | Seasonal hires on simple operations | Recruiting cost | Quality variance |
| Subcontracting | Overflow to partner factories | Management overhead | Consistency risk |
| Pre-production | Build inventory ahead of peak | Working capital | Forecast error |
| Capacity reservation | Buyers book slots early | Discounts for commitment | Planning rigidity |
The Peak-Season Rules
- Book early — buyers who reserve capacity in the shoulder season get real slots; last-minute orders get leftovers.
- Pre-produce standard products — forecast-driven pre-production smooths the peak.
- Protect quality — peak season is when quality slips; maintain first-piece checks and in-line QC even under pressure.
- Communicate honestly — a factory that says “we cannot fit your order before October” in August is protecting both sides.
Capacity-Driven Quoting and Pricing
Capacity planning feeds directly into pricing — labor cost is the largest variable in most backpack costs.
The Labor Cost Calculation
| Variable | Value |
|---|---|
| SAM per pack | 32 min |
| Operator hourly cost (loaded) | $3.50 |
| Minutes per hour | 60 |
| Labor cost per pack | 32 ÷ 60 × $3.50 = $1.87 |
| Efficiency factor | ÷ 0.80 → $2.34 effective |
How Capacity Changes the Quote
| Situation | Effect on quote |
|---|---|
| Line has open capacity | Standard price, normal lead time |
| Line is fully loaded | Higher price (overtime) or longer lead time |
| Rush order displaces others | Priority premium, buyer pays the displacement cost |
| Peak-season order | Seasonal premium, or earlier booking discount |
| Small order on dedicated line | Higher per-unit (setup spread thinly) |
The SLA Conversation
For critical orders, put the commitment in writing:
- Delivery date with buffer
- Penalty or compensation terms for lateness
- Status reporting cadence (weekly)
- Escalation path for delays
- What happens if materials arrive late (shared responsibility)
Manufacturer’s note: The most honest factories quote labor cost from measured SAM, not from last year’s average. When buyers ask why a quote changed, the answer should reference the design’s real labor content and the current line loading — not a vague “market conditions.” Capacity data makes pricing explainable, and explainable pricing builds trust.
Monitoring Capacity: The Daily Scoreboard
A capacity plan without monitoring is a guess with a date on it. The factories that deliver consistently track the numbers daily.
The Key Metrics
| Metric | What it measures | Watch for |
|---|---|---|
| Output per line | Actual packs per day | Falling vs planned |
| Efficiency % | Actual vs standard time | Drift below 70% |
| On-time rate | Orders shipped on date | Below 90% |
| Rework rate | Defective work share | Rising trend |
| Bottleneck queue | Work waiting at constraint | Growing queue |
| Utilization | Line busy time share | 90%+ with no buffer |
The Daily Routine
- Morning — check yesterday’s output vs plan.
- Midday — verify bottleneck queue length.
- Evening — record output, efficiency, and issues.
- Weekly — review trends and adjust staffing.
The Continuous Improvement Loop
Capacity is not fixed — it grows with improvement:
- Measure SAM accurately — re-time operations periodically; designs and methods change.
- Balance the line — redistribute work from overloaded to underloaded stations.
- Reduce changeover time — standardize setups, prepare materials in advance.
- Train cross-functionally — flexible operators smooth bottlenecks.
- Fix the top defect — each defect eliminated recovers capacity.
- Review the schedule weekly — replan against reality, not last month’s plan.
Manufacturer’s note: The factory that improves capacity by 10% a year through small, continuous gains is more valuable than the factory that quotes a 20% lead-time advantage once. Continuous improvement compounds; optimistic promises do not. Buyers should ask not only what a factory can do today, but how it has grown its capacity over the past two years.
The Capacity Improvement Tracker
| Improvement | Typical gain | Investment |
|---|---|---|
| Line rebalancing | +5–15% output | Time, analysis |
| Changeover reduction | +3–10% capacity | Process discipline |
| Cross-training | +5% flexibility | Training time |
| Defect reduction | +3–8% effective capacity | QC investment |
| New machines | +10–30% on bottleneck | Capital |
The Buyer’s Role in Capacity Success
Capacity planning is the factory’s job, but buyers shape its success more than they realize. The buyers who get on-time delivery are the ones who plan with the factory, not against it.
The Buyer Behaviors That Protect Delivery
| Behavior | How it helps |
|---|---|
| Order early in the season | Real slots, not squeezed ones |
| Confirm materials early | Material lead time runs in parallel |
| Freeze designs before production | No mid-run changes that reset the line |
| Approve samples fast | The sample loop is part of the schedule |
| Pay on time | Stable factory operations |
| Book capacity for reorders | The factory can plan around you |
| Communicate forecast | The factory can pre-order materials |
The Forecast Conversation
A simple forecast exchange changes everything:
- Buyer shares expected annual/quarterly volume.
- Factory reserves capacity and pre-negotiates material.
- Both sides agree on booking windows and flexibility.
- Surprises become exceptions, not the norm.
The Rush Order Reality
Rush orders are possible but expensive:
| Rush type | What it costs |
|---|---|
| Overtime on your order | +10–25% labor premium |
| Displacing other orders | Your price or theirs — someone pays |
| Air freight instead of sea | 3–5× freight cost |
| Quality risk | Rushed lines make more defects |
Manufacturer’s note: The buyers who never miss a season do the same things: they plan early, they freeze designs, they communicate volume, and they accept that rush costs money. Capacity is a shared resource — the buyer who treats the factory as a partner in the plan gets the plan to work.
The Common Buyer Misconceptions
- “Shorter lead time quoted = better factory.” False — honest factories quote realistic lead times.
- “I can always rush at the end.” Expensive and risky — rush costs multiply in peak season.
- “The factory should absorb my delays.” Material and design delays are shared — plan them.
- “Price is the only thing that matters.” Capacity reliability is worth paying for.
The Capacity Reality Check
Before committing to a factory, run this quick capacity reality check:
- [ ] Factory shared its current line loading and utilization
- [ ] SAM or labor content provided for your product type
- [ ] On-time delivery rate for recent orders shared
- [ ] Material lead times quoted and confirmed
- [ ] Capacity gate confirmed (no order quoted without a slot)
- [ ] Buffer policy explained (how much, where)
- [ ] Peak-season policy understood
- [ ] Weekly status reporting agreed
A factory that answers these with numbers is planning. A factory that answers with promises is guessing — and guessing factories miss dates.
FAQ
How do I calculate a backpack factory’s real capacity?
Use the formula: daily output = (operators × working minutes × efficiency) ÷ SAM. For example, 30 operators × 480 minutes × 80% efficiency ÷ 32 minutes SAM ≈ 360 packs per day. Use realistic efficiency (70–85%), not theoretical 100%.
What is SAM in backpack manufacturing?
SAM (Standard Allowed Minutes) is the time a trained operator takes to complete one operation under normal conditions. A typical 25 L backpack totals 25–45 minutes of SAM across cutting, sewing, and assembly. SAM is the basis for capacity and cost calculations.
What is a realistic lead time for a custom backpack order?
Typically 8–16 weeks total: 2–4 weeks for samples, 2–6 weeks for materials, 2–6 weeks for production, plus QC, packing, and shipping. The honest quote adds buffer for materials and peak-season congestion — a realistic promise beats an optimistic guess.
Why do backpack factories miss delivery dates?
The common causes: planning at unrealistic efficiency, overbooking beyond capacity, assuming materials are available, ignoring changeover time, counting new operators at full speed, and scheduling QC as an afterthought. A capacity gate before quoting prevents most of these.
What should I ask a factory about its capacity before ordering?
Ask: is this lead time based on current line loading? What is your capacity utilization? What is your on-time delivery rate over the last three orders? How do you handle material delays? The answers separate planning factories from guessing factories.
Can a factory speed up production for my order?
Sometimes — through overtime, priority scheduling, or more operators on the line. But speed costs: overtime raises prices, priority displaces other orders, and rushed lines risk quality. The honest conversation is about what the speed costs, not whether it is possible.
What is a capacity gate and why does it matter?
A capacity gate is a rule that no order is quoted until production confirms a line slot exists. It prevents overbooking — the root cause of most missed deliveries. Sales quotes the confirmed slot, not a guess, and the factory’s promises become real.
The Seven Capacity Truths
Every factory and every buyer should internalize these:
- Capacity is measured, not assumed — SAM, efficiency, and staffing produce the number.
- The bottleneck defines the line — find it, feed it, protect it, improve it.
- Materials are capacity — a line waiting for fabric produces nothing.
- Changeovers are capacity lost — schedule same-material styles together.
- Buffer is honesty — a plan without buffer is a promise without intent.
- Peak season changes everything — book early or pay rush premiums.
- The capacity gate is non-negotiable — no slot, no quote, no disappointment.
Factories that live by these truths ship on time. Buyers who verify them choose factories that ship on time. Everything else is luck, and luck is not a supply chain strategy.
Conclusion
Capacity planning is the quiet discipline behind every on-time shipment. It starts with honest numbers — real SAM, realistic efficiency, and actual staffing — and builds from there: line organization, bottleneck management, disciplined scheduling, and lead-time commitments that include buffer. It ends with a capacity gate that makes promises real and a relationship built on truthful communication.
For buyers, the lesson is simple: ask about capacity before you ask about price. A factory that knows its numbers can promise with confidence; a factory that guesses will cost you a season. The factories that plan their capacity are the factories that deliver — and the buyers who check capacity planning choose their partners wisely.
If you are planning an order and need a realistic lead-time commitment, our factory runs capacity calculations on every quote — current line loading, material lead times, and honest buffers included. Ask us for the numbers, not just the date.