Fabric Inventory Control: How Do Bag Factories Manage Stock?
Fabric Inventory Control: How Do Bag Factories Manage Stock?
A bag factory holds two kinds of numbers at the same time: the quantity of material it owns, and the quantity it can actually use. The gap between them is where inventory losses live.
A roll that is recorded as three hundred metres but yields two hundred and seventy because of defects has already lost thirty metres of margin. A trim component sitting in the wrong bin holds up a line. A fabric lot from a different dye batch cannot be used alongside the previous one without a visible shade break.
Inventory control in bag manufacturing is therefore not a counting exercise. It is the discipline of knowing what material exists, where it is, which production it is committed to, whether it is still usable, and how much of it is not moving at all. Factories that manage it protect their margin and their delivery dates. Factories that do not discover the truth when a line stops.
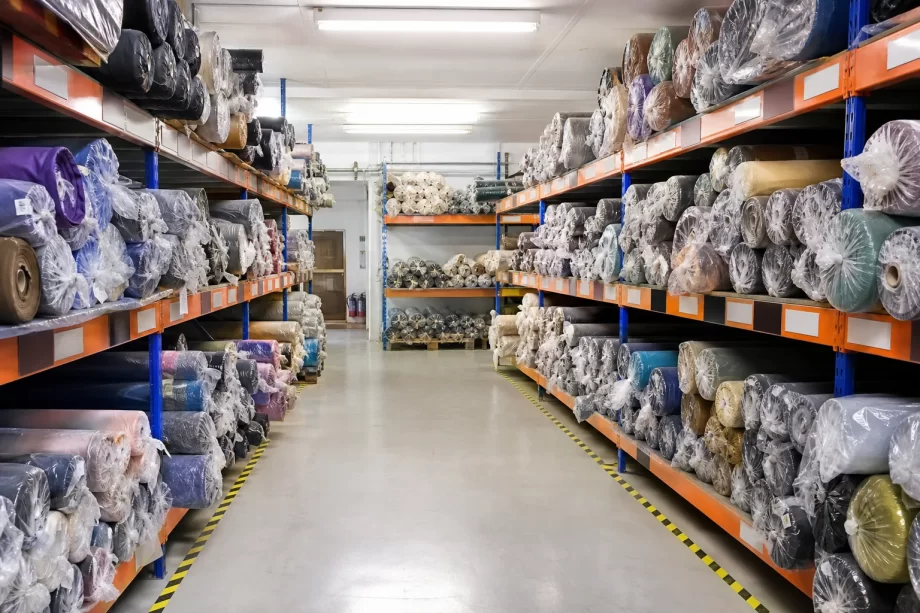
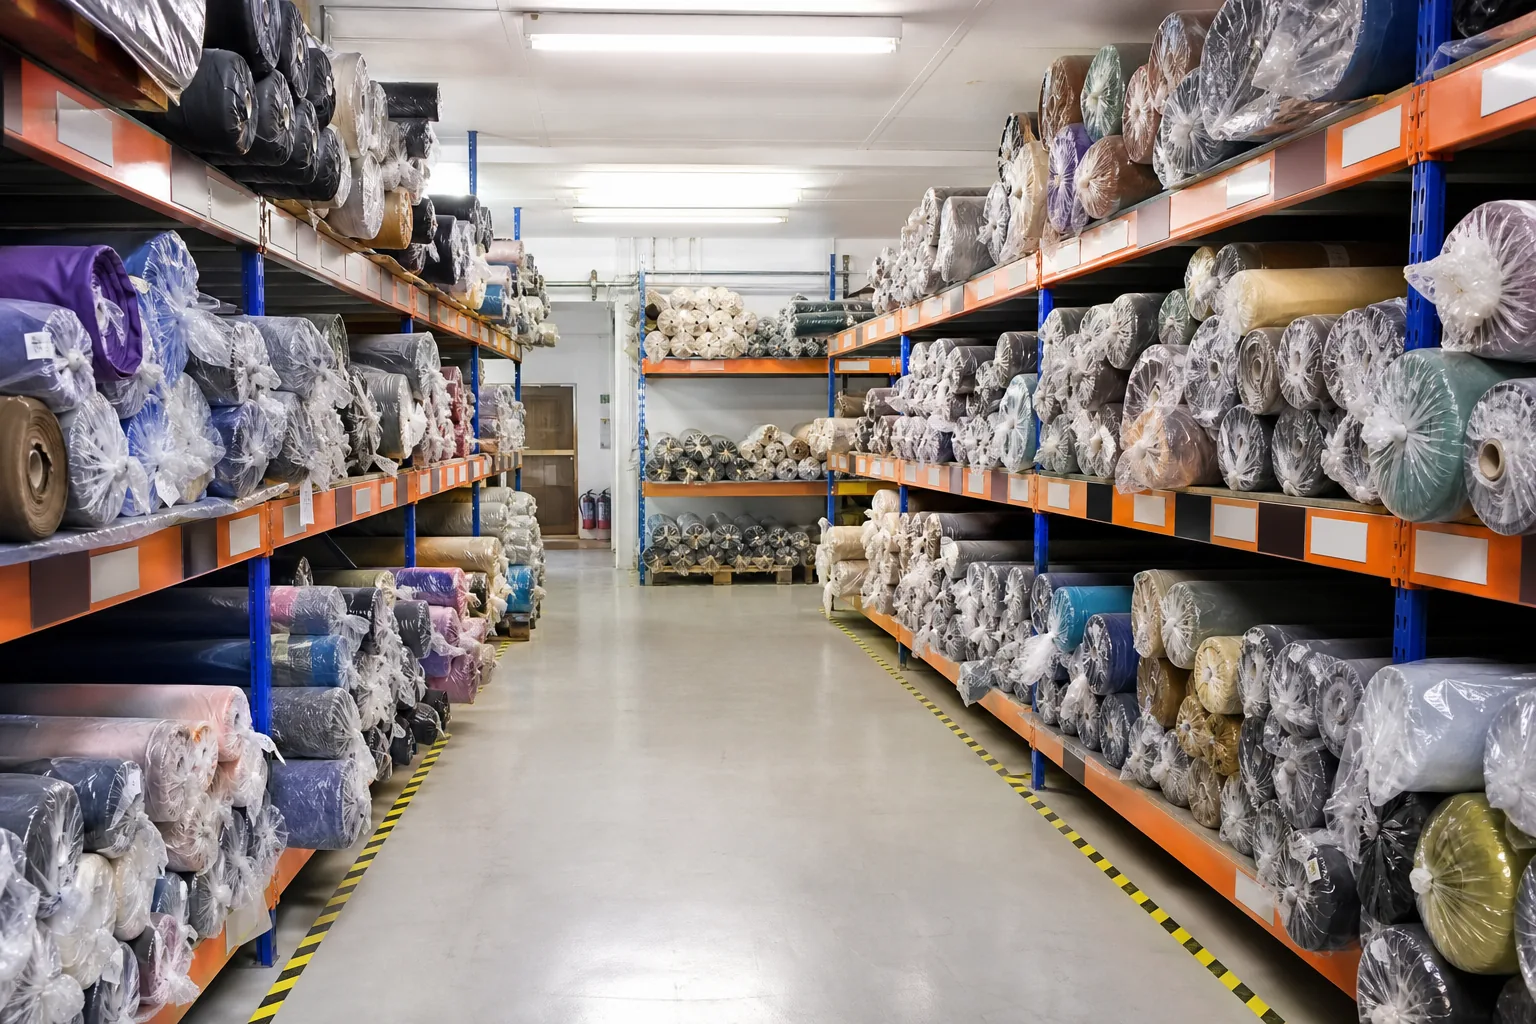
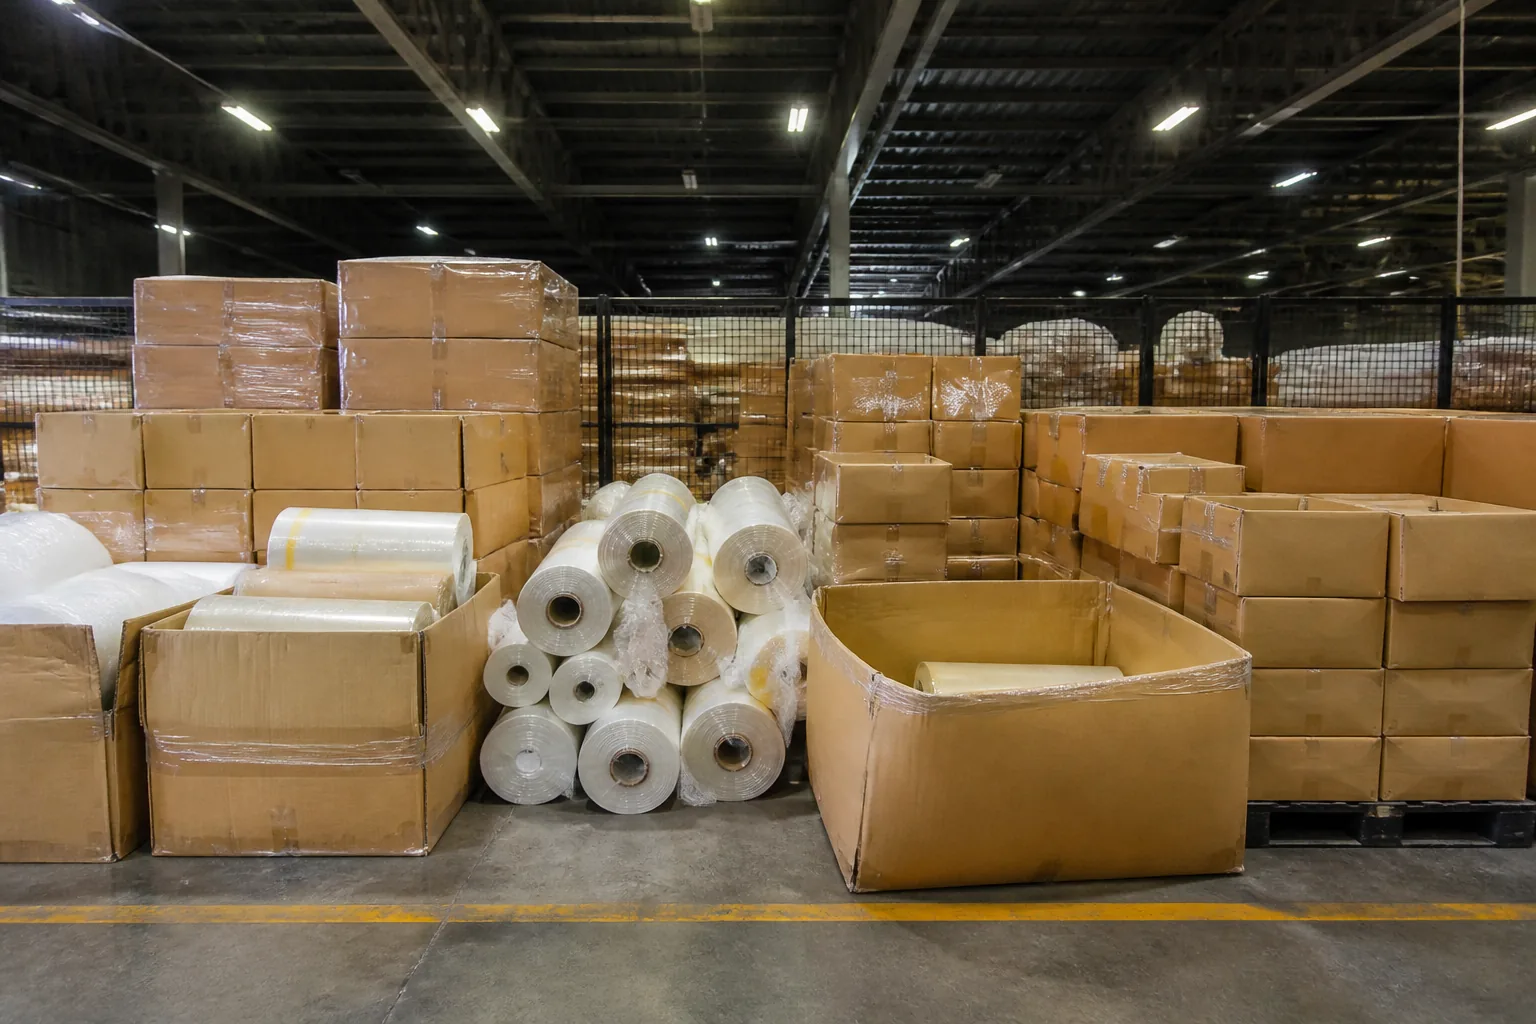
Fabric store room in a bag factory with rolls stacked on labelled racks
This guide covers fabric and trim inventory control from a bag manufacturer’s perspective: why stock control matters commercially, how materials are classified and coded, and how safety stock is set against lead time and variability.
It then covers how batch and shade are managed so that colour does not drift between lots, how storage locations and first-in-first-out issuing prevent deterioration and mix-ups, how cycle counting keeps records honest, and how slow-moving and obsolete material is identified and disposed of. It closes with the turnover metrics that actually change behaviour and how a control system is put in place.
Material represents the largest single block of working capital in a bag factory, and it is the block most easily damaged by neglect. Controlling it affects cost, quality, and delivery at the same time.
The Inventory Cost Table
Cost
Character
Capital tied up
Financing cost
Storage space
Rent and handling
Handling labour
Receiving to issuance
Deterioration
Age and condition
Obsolescence
Style or colour change
Shrinkage and loss
Unrecorded consumption
Insurance and risk
Value at risk
The Consequence Table
Failure
Effect
Stock-out on a critical trim
Line stoppage
Shade mix-up between lots
Visible colour break
Wrong location
Search time and delay
Age deterioration
Rejection at the cutting table
Unrecorded over-issue
Cost absorbed silently
Dead stock carried
Capital frozen
The Control Objective Table
Objective
Measure
Availability
Orders covered without shortage
Accuracy
Record against physical
Freshness
Age of material issued
Traceability
Lot linked to production
Utilisation
Consumed against purchased
Visibility
Time to answer a stock query
The Inventory Type Table
Type
Purpose
Raw material
Shell fabric, lining, webbing
Components
Zippers, buckles, labels
Consumables
Thread, tape, adhesives
Work in progress
Cut and partly assembled
Finished goods
Awaiting shipment
Spare and packaging
Cartons and bags
Manufacturer note: The most expensive inventory failure in a bag factory is rarely the material that is missing. It is the material that is present, recorded, and unusable. A roll that has aged and delaminated, a hardware lot that no longer matches the current revision, or a fabric shade that cannot be cut with anything else will still appear as an asset in the records while behaving as a liability on the floor. Effective control therefore tracks condition and usability, not only quantity.
Classification, Coding and Safety Stock
A material can only be controlled if it can be identified. The classification scheme determines how much attention each item receives, and the coding scheme determines whether a record can be linked back to a physical object.
The Classification Table
Class
Basis
A
High value or high usage
B
Moderate value
C
Low value, high count
Critical
Stops the line if absent
Long lead time
Ordered far in advance
Style specific
Tied to a single program
The Coding Table
Element
Purpose
Material code
Unique identifier
Description
Specification reference
Unit of measure
Metres, pieces, kilograms
Supplier
Source
Lot or batch
Traceability
Colour reference
Shade control
Location
Physical address
Status
Released, quarantine, hold
The Safety Stock Driver Table
Driver
Effect on the level
Lead time
Longer means more
Lead time variability
Unstable means more
Demand variability
Volatile means more
Supplier reliability
Weak means more
Minimum order quantity
Raises the practical level
Shelf life
Limits the level
The Safety Stock Method Table
Method
Basis
Fixed quantity
Set figure per item
Days of cover
Consumption multiplied by days
Statistical
Variability and service level
Two-bin
Reorder when the second bin opens
Min-max
Order between limits
The Reorder Table
Element
Content
Reorder point
Level that triggers an order
Order quantity
Economic or supplier-driven
Lead time
Confirmed, not assumed
Review interval
How often checked
Escalation
What happens if late
The Stock Status Table
Status
Meaning
Released
Available for production
Quarantine
Awaiting inspection
Hold
Suspected problem
Reserved
Allocated to an order
Slow-moving
Not used for a defined period
Obsolete
No longer usable
Batch and Shade Control
Dyed fabric is not uniform between production runs, and the difference is often invisible until two lots are placed side by side on a cutting table. Batch control is the practice that keeps a bag made in March matching a bag made in June.
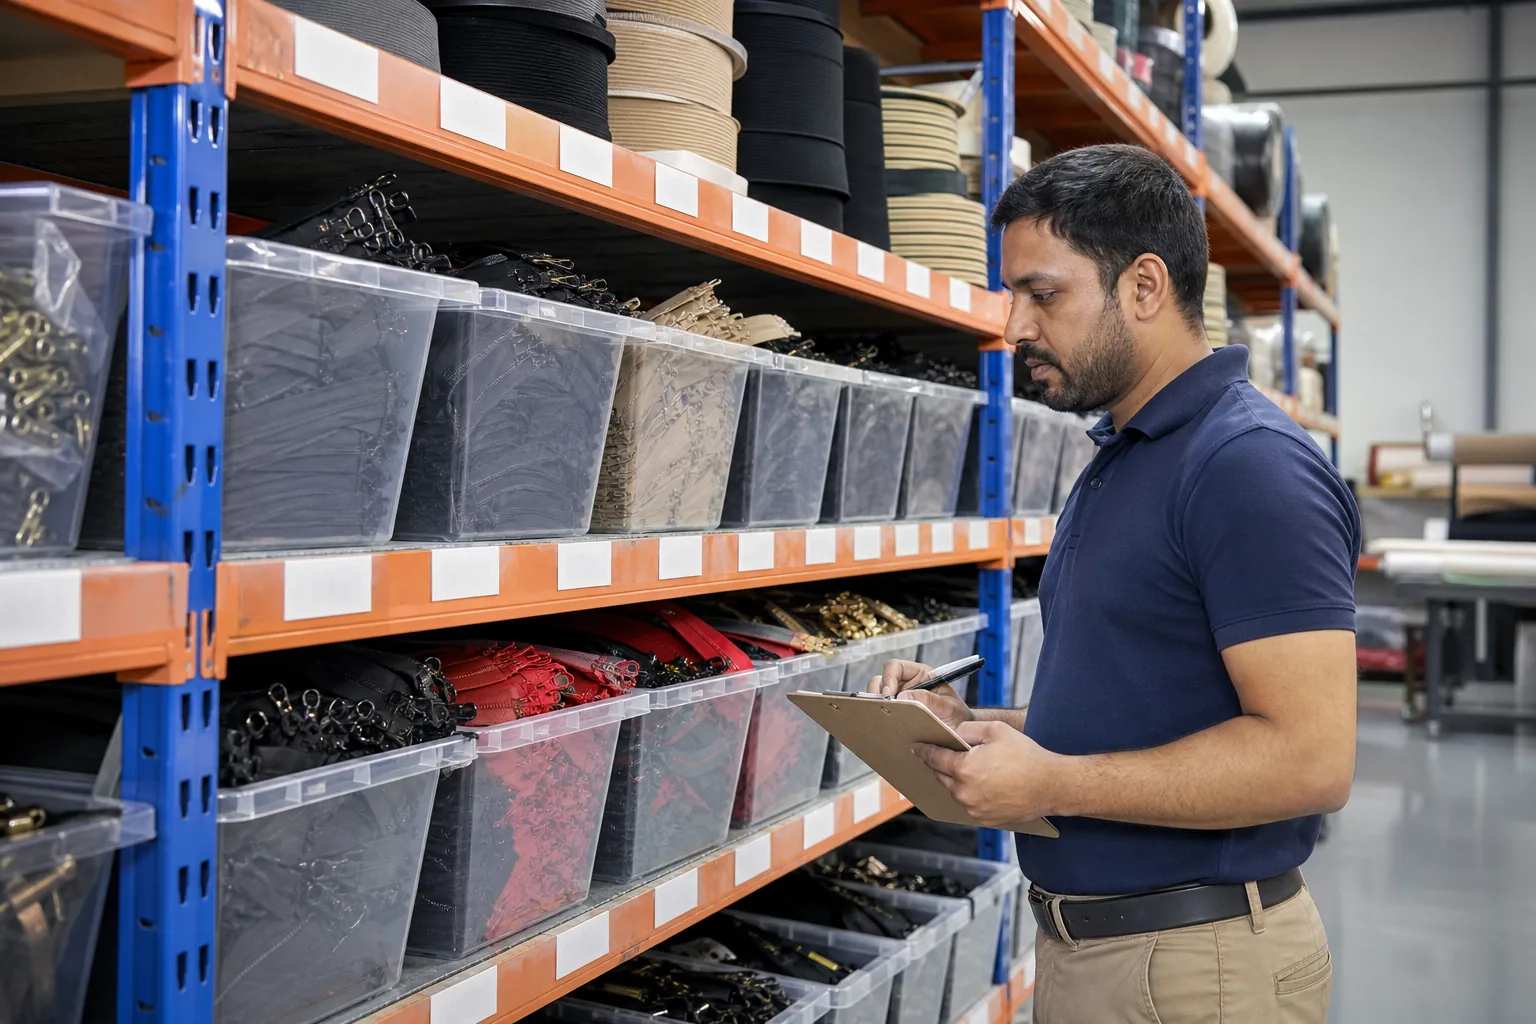
Storekeeper checking labelled racks of zippers, webbing and trim
The Shade Risk Table
Risk
Consequence
Two dye lots in one order
Visible shade break
Lot mixed across panels
Patchy appearance
No physical standard
Dispute with no reference
Different mill batch
Slight tone shift
Coating applied separately
Surface difference
Storage exposure
Fading and soiling
The Batch Recording Table
Element
Recorded
Mill lot number
As received
Dye batch
From the supplier
Receipt date
On arrival
Inspection result
Registered
Storage location
Physical address
Consumption
Which order used it
The Shade Control Table
Method
Practice
Physical standard
Retained reference swatch
Standard light source
Agreed viewing condition
Swatch per lot
Kept with the roll
Comparison on receipt
Against the standard
Comparison before cutting
Lots to be combined
Panel marking
Lot on the cut ticket
The Lot Combination Table
Situation
Rule
Same lot across the order
Preferred
Two lots, large order
Cut per lot, keep sets separate
Two lots, small order
Compare before combining
Close but not identical
Segregate by component
Clearly different
Reject or use on another style
The Segregation Table
Reason
Practice
Shade difference
Separate location and label
Different lot
Separate bin
Different revision
Separate and marked
Quarantine
Physically separated
The Documentation Table
Record
Purpose
Receiving note
Quantity and lot
Inspection sheet
Result and defects
Swatch file
Shade reference
Issue slip
What left the store
Consumption record
Lot to order link
Storage, Location and Issuing
Where material is stored decides how quickly it can be found, how well it survives, and whether the oldest stock is used first. Good storage is a set of decisions about addresses, conditions, and issuing rules.
The Storage Location Table
Element
Practice
Address system
Zone, rack, level, position
Labelling
Visible from the aisle
Capacity marking
Limits on the bin
Segregation
By status and lot
Accessibility
Fast movers near the issue point
Housekeeping
Clean and dry
The Storage Condition Table
Factor
Requirement
Humidity
Controlled to avoid mould
Temperature
Stable, away from heat
Light
Away from direct sunlight
Dust
Covered where needed
Pests
Prevented and monitored
Stacking
Within load limits
Handling
Rolls not dragged
The Roll Storage Table
Method
Consideration
Horizontal rack
Common, protects the core
Vertical
Saves space, can deform
Palletised
Efficient for heavy rolls
Suspended
For delicate material
The FIFO Rule Table
Rule
Reason
Issue oldest first
Limits deterioration
Date marked on receipt
Enables ordering
Location sequence
Physical flow matches age
Exception process
When FIFO cannot be followed
Record of deviation
Visibility
The Issuing Table
Step
Control
Request raised
Against a work order
Quantity agreed
Within the allowance
Lot selected
By FIFO
Issue recorded
Against the order
Balance updated
Record adjusted
Return handled
Unused material returned
The Shortage Table
Situation
Response
Issue exceeds allowance
Investigate before replacing
Balance disagrees
Count immediately
Stock-out on a critical trim
Escalate to planning
Wrong lot issued
Contain and recover
Counting and Record Accuracy
A stock record is a claim about the physical world. Cycle counting is how the claim is tested, and how discrepancies are found before they become shortages.
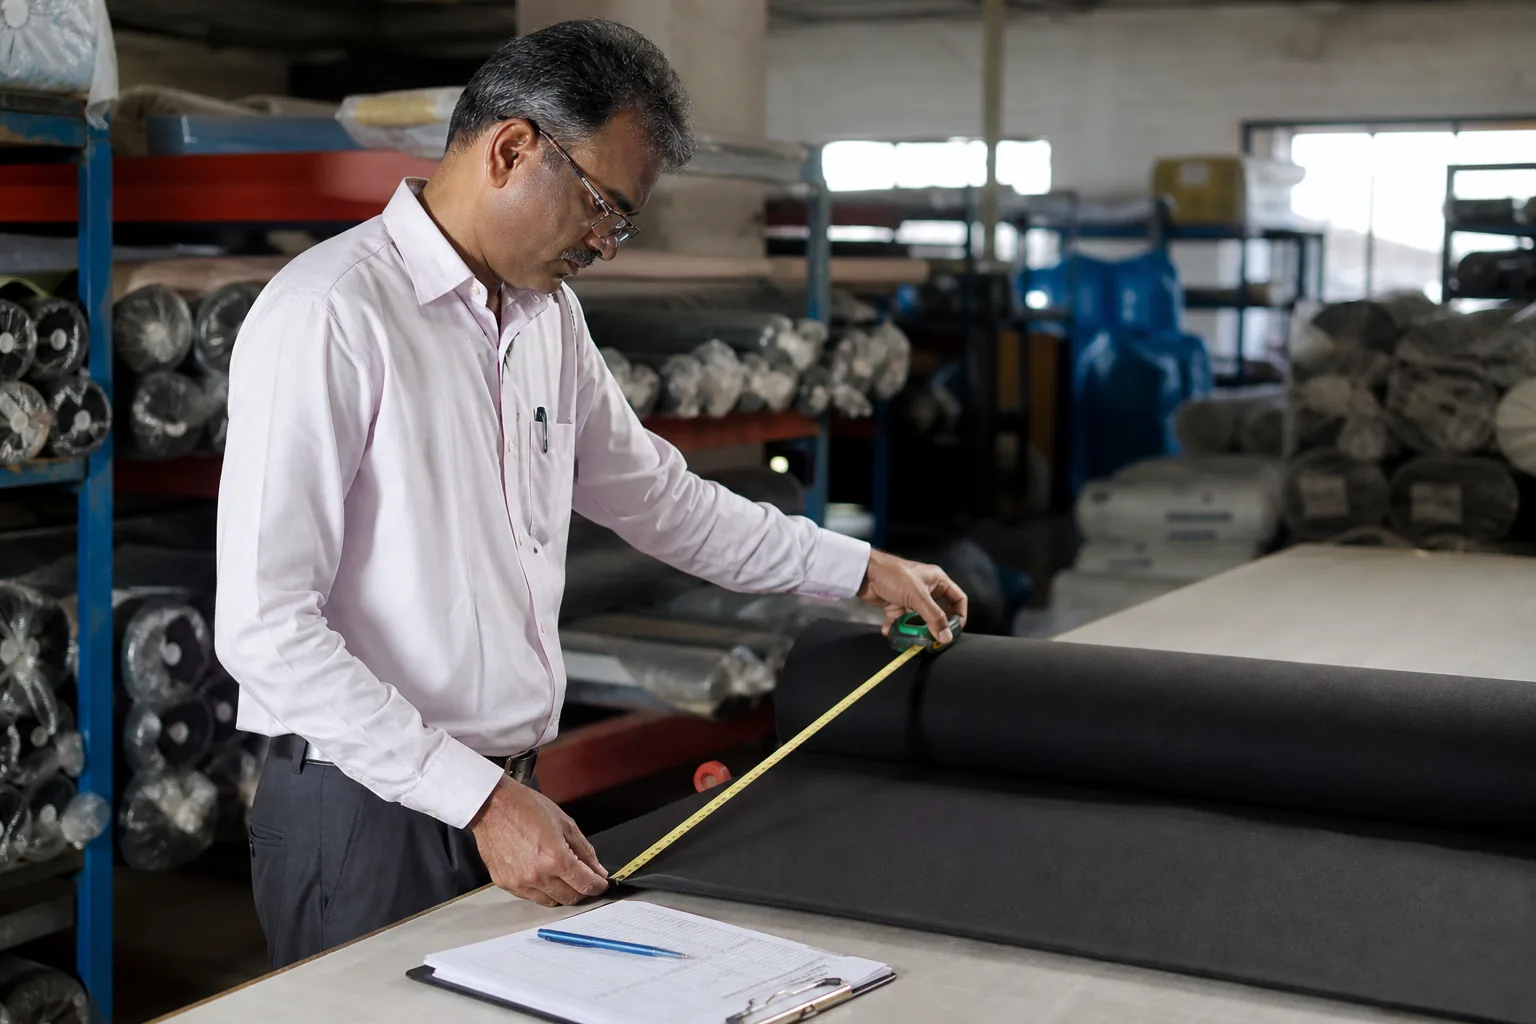
Stock counter measuring and recording a fabric roll during a cycle count
The Counting Method Table
Method
Character
Annual full count
Complete but disruptive
Cycle count
Continuous sampling
Spot check
Random verification
Perpetual
Updated on every movement
Blind count
Counter does not see the record
The Cycle Count Design Table
Element
Decision
Frequency
By class and value
Scope per session
Items to be counted
Counter
Independent of the storekeeper
Record hidden
Blind count preferred
Tolerance
Acceptable difference
Investigation trigger
When tolerance is exceeded
The Frequency Table
Class
Typical frequency
A
Monthly or more
B
Quarterly
C
Semi-annual
Critical
Frequent and targeted
The Discrepancy Table
Cause
Likely source
Record higher than physical
Unrecorded issue or loss
Physical higher than record
Unrecorded receipt or return
Small consistent gap
Unit or measurement error
Large isolated gap
Theft or misplacement
Recurring same item
Process failure at that station
The Root Cause Table
Cause
Corrective focus
No record on issue
Discipline at the store
Wrong unit of measure
Coding correction
Unrecorded return
Return process
Damage not reported
Inspection and reporting
Transposition error
Data entry control
The Record System Table
System
Character
Manual cards
Simple, prone to lag
Spreadsheet
Flexible, version risk
ERP module
Integrated, needs discipline
Barcode issue
Fast and accurate
Hybrid
Practical in many factories
The Accuracy Metric Table
Metric
Definition
Record accuracy
Compliant counts as a share of counts
Location accuracy
Items found where recorded
Issue accuracy
Correct lot and quantity issued
Timeliness
Movements recorded same day
The Improvement Table
Action
Effect
Blind counting
Removes expectation bias
Same-day recording
Prevents drift
Barcode at issue
Reduces entry error
Dedicated storekeeper
Raises accountability
Regular review
Sustains discipline
Slow-Moving, Surplus and Obsolete Stock
Every store accumulates material that is no longer moving. The question is whether it is identified, valued honestly, and dealt with, or left to occupy space until it is discovered during an audit.
Segregated excess and slow-moving material in a factory store
The Ageing Bucket Table
Bucket
Meaning
Current
Within normal usage period
Slow-moving
No movement for a set period
Surplus
More than foreseeable demand
Obsolete
No longer required
The Ageing Trigger Table
Trigger
Threshold
No issue for the period
Set by material class
Balance above foreseeable demand
By program forecast
Style discontinued
Immediately
Revision superseded
Immediately
Shelf life exceeded
By specification
Shade no longer matchable
On assessment
The Cause Table
Cause
Origin
Over-ordering
Minimum order quantity
Forecast cancelled
Program change
Colour change
Design revision
Specification change
Engineering update
Over-issue never returned
Store discipline
Defective lot retained
No disposal decision
The Disposition Table
Option
When applicable
Use on a future order
Demand exists
Substitute for another style
Technically suitable
Sell or return to supplier
Agreed arrangement
Use for samples
Non-production use
Downgrade to packaging
Lower requirement
Scrap and recycle
No use available
The Decision Step Table
Step
Action
1
Identify on the ageing report
2
Confirm physical condition
3
Check against forward demand
4
Assess technical suitability
5
Choose a disposition
6
Record and execute
7
Update records
The Provision Table
Category
Accounting treatment
Slow-moving
Review and monitor
Surplus
Consider a provision
Obsolete
Written down
Damaged
Written off
The Prevention Table
Measure
Effect
Order against confirmed demand
Reduces surplus
Consolidate minimum order quantities
Fewer part rolls
Review before reordering
Avoids duplication
Return arrangement with suppliers
Reduces dead stock
Disciplined returns from the line
Recovers usable material
Turnover Metrics That Change Behaviour
Metrics are useful when they lead to a decision. In inventory control the useful measures describe how fast material moves, how well the record matches reality, and how much of the balance is not working.
The Core Metric Table
Metric
Calculation basis
Inventory turnover
Consumption divided by average stock
Days of inventory
Average stock divided by daily consumption
Record accuracy
Compliant counts as a share
Slow-moving share
Slow-moving value as a share of total
Stock-out rate
Shortages as a share of issues
Shrinkage
Difference found at count
The Turnover Benchmark Table
Material
Expectation
High-usage shell fabric
Turns quickly
Common lining
Turns quickly
Seasonal colour
Turns within the season
Style-specific trim
Turns with the program
Custom hardware
Turns with the program
The Metric Pitfall Table
Pitfall
Effect
Turnover raised by understocking
Shortages rise
Accuracy claimed from paper counts
Record drift hides
Value metrics hide volume problems
Slow items overlooked
Single figure for all classes
Wrong attention
The Dashboard Table
Indicator
Frequency
Stock value
Monthly
Turnover
Monthly
Record accuracy
Per count cycle
Slow-moving value
Monthly
Stock-out events
Weekly
Ageing profile
Monthly
The Review Table
Question
Purpose
What is not moving?
Directs disposal
What is short?
Directs expediting
What is inaccurate?
Directs discipline
What is over-stocked?
Directs purchasing
Linking Inventory Control to Purchasing and Planning
Inventory is the physical result of purchasing and planning decisions. A store can control accuracy, but it cannot fix a forecast that does not exist.
The Interface Table
Function
Contribution
Planning
Demand and timing
Purchasing
Order point and quantity
Store
Receipt, storage, issue
Production
Consumption and returns
Finance
Valuation and provision
The Planning Input Table
Input
Use
Order book
Confirmed demand
Forecast
Expected demand
Bill of materials
Requirement per bag
Allowance
Waste factor
Lead time
Order timing
The Purchasing Decision Table
Factor
Consideration
Minimum order quantity
Creates surplus
Price break
Encourages over-buying
Lead time
Requires early commitment
Colour risk
Favours smaller lots
Supplier reliability
Reduces the buffer needed
The Allowance Table
Allowance
Purpose
Cutting waste
Covers marker loss
Defect allowance
Covers reject panels
Lab and sample
Development usage
Overage
Planned extra
The Consumption Feedback Table
Data
Value
Actual against allowance
Reveals waste trend
Issues per order
Verifies the bill of materials
Returns from the line
Recovers usable stock
Losses recorded
Enables correction
The Communication Table
Meeting
Content
Weekly planning
Shortages and priorities
Monthly review
Turnover and ageing
Per order
Material readiness
Exception
Stock-out or surplus
Setting Up an Inventory Control System
A control system does not have to start with software. It starts with addresses, rules, and records, and it improves as those three become consistent.
The Setup Step Table
Step
Activity
1
List every material and assign a code
2
Clean and reorganise the store
3
Assign and label a location for each item
4
Count and record the opening balance
5
Write the issue and return rules
6
Start cycle counting
7
Report ageing and turnover
The Code Design Table
Element
Recommendation
Structure
Consistent and expandable
Length
Short enough to write by hand
Meaning
Material type plus attribute
Uniqueness
No duplicates across styles
Stability
Does not change with a rename
The Label Content Table
Field
Purpose
Material code
Identification
Description
Recognition
Lot number
Traceability
Quantity
Balance at a glance
Receipt date
FIFO control
Status
Released or held
Location
Physical address
The Store Layout Table
Zone
Content
Receiving
Awaiting inspection
Main store
Released material
Fast-move area
High-usage items
Quarantine
Held material
Slow-moving area
Ageing stock
Return area
Material from the line
The Rule Table
Rule
Purpose
No material without a work order
Controls issue
Record at the moment of movement
Keeps the record true
Issue oldest first
Limits deterioration
Return unused material the same day
Prevents hoarding on the floor
No self-service issue
Preserves accountability
Damaged material reported immediately
Enables disposition
The Role Table
Role
Responsibility
Storekeeper
Receipt, storage, issue, records
Store supervisor
Layout, control, verification
Inventory clerk
Counting and reconciliation
Planner
Demand and requirement
Quality
Inspection and status
The System Selection Table
Scale
Suitable approach
Small
Cards and a spreadsheet
Growing
Barcode plus a simple system
Established
ERP inventory module
Multi-site
Central system with local control
The Barcode Table
Application
Benefit
Receipt labelling
Fast and accurate record
Location labelling
Confirms the pick
Issue scanning
Prevents wrong lot
Count scanning
Speeds the cycle count
Common Problems and How to Correct Them
Inventory problems repeat across factories because the underlying causes repeat. Recognising the pattern shortens the correction.
The Problem Table
Problem
Underlying cause
Record does not match stock
Movements not recorded
Line stops for a trim
No reorder point on that item
Shade break in a shipment
Lots combined without comparison
Material found damaged
Storage condition or handling
Space always short
Dead stock never disposed
Repeated over-issue
Allowance not measured
Stock value rising
Ordering without demand
The Correction Table
Problem
Corrective action
Record drift
Same-day recording and cycle counting
Trim stock-outs
Set reorder points per item
Shade break
Lot comparison before cutting
Damage
Fix storage and handling
Space short
Run the ageing review
Over-issue
Measure consumption against allowance
Rising value
Review purchasing against demand
The Discipline Table
Practice
Effect
Five-minute daily tidy
Prevents accumulation
Weekly location check
Catches misplacement
Monthly ageing review
Drives disposal
Quarterly layout review
Keeps flow efficient
Annual full count
Confirms the system
The Improvement Priority Table
Priority
Action
1
Make every location labelled and findable
2
Record every movement the same day
3
Set reorder points for critical items
4
Start blind cycle counting
5
Run a monthly ageing review
6
Report turnover and accuracy
Manufacturer note: A buyer can assess a factory’s inventory control in ten minutes without reading a single report. Ask to be shown a specific trim component in the store, ask which work order it is reserved for, ask how old the oldest roll of the main fabric is, and ask what happens to material returned from the line. A store that answers all four from records is controlled. A store that answers from memory is being managed by the people in it rather than by a system, and it will behave differently when those people are on leave.
The Inventory Control Checklist
Records and Coding
Item
Done
Every material has a unique code
☐
Unit of measure defined per item
☐
Lot number recorded on receipt
☐
Status recorded and visible
☐
Opening balance counted and entered
☐
Movements recorded the same day
☐
Storage
Item
Done
Every item has a labelled location
☐
Zones separated by status
☐
Reorder points set for critical items
☐
Raw materials protected from damp and light
☐
Stacking within safe limits
☐
Fast-moving items near the issue point
☐
Batch and Shade
Item
Done
Physical shade standard retained
☐
Swatch kept with each lot
☐
Lots compared before cutting together
☐
Separate locations for different lots
☐
Lot recorded on the cut ticket
☐
Issuing and Counting
Item
Done
Issue only against a work order
☐
Oldest material issued first
☐
Unused material returned same day
☐
Blind cycle count performed
☐
Discrepancies investigated
☐
Record accuracy reported
☐
Ageing and Disposal
Item
Done
Ageing report reviewed monthly
☐
Slow-moving stock identified
☐
Disposition decided and executed
☐
Obsolete stock written down
☐
Prevention measures applied
☐
The Eight Rules
Rule
Reason
No material without a code
Identification enables control
Record the movement when it happens
The record decays in hours
Issue the oldest first
Age is the hidden cost
Compare lots before combining
Shade breaks cannot be corrected later
Count blind
Expectation bias hides errors
Review ageing every month
Dead stock grows silently
Measure consumption against allowance
Losses hide in the allowance
Track usability, not only quantity
Present but unusable is still a loss
FAQ
How much safety stock should a bag factory hold?
The level should follow the risk of running out, not a round number. Longer lead times, unstable lead times, unrelenting suppliers, and volatile demand all push the level up; a short, reliable lead time and a stable order book push it down. In practice, factories set safety stock in days of cover per item rather than one figure for everything, and they distinguish between material that stops the line, such as a specific zipper or buckle, and material that can be substituted or resourced quickly. Shelf life also caps the level, because a large buffer of a material that ages is a liability rather than a protection.
How should we handle fabric shade differences between lots?
With a physical standard and a comparison step. Keep a retained reference swatch for each colour, compare each incoming lot against it under an agreed light source, and keep a swatch with the roll so the comparison is available at the cutting table. Before combining two lots in one order, cut a small comparison piece from each and view them side by side; where the difference is visible, the lots should be separated, with one lot reserved for a component that is not adjacent to the other, or the material held for a different style. Never combine lots with a visible difference on the same visible panel.
Is first-in-first-out always practical?
It is always the default, but there are situations where it cannot be followed, and the important thing is that the deviation is recorded rather than silent. A colour that is going out of the range, a shade that matches the current order better than the older lot, or a small balance too short to cut a full panel may each justify issuing a newer roll first. Where that happens, the older lot should be marked for review rather than left to age unnoticed. The rule exists to prevent material from deteriorating in storage, not to be followed blindly when the material would be consumed anyway.
How often should we count inventory?
Continuously, in small pieces, rather than once a year in one painful exercise. Cycle counting assigns each item a counting frequency based on its value and criticality, so high-value and line-stopping items are counted monthly while low-value items are counted twice a year. This spreads the work, keeps the store operating during the count, and finds discrepancies close to the moment they occur, which is when the cause can still be identified. An annual full count is still useful as a confirmation, but it should not be the only count, because by the time it happens the causes have usually been forgotten.
What is the biggest cause of inventory record errors?
Movements that are not recorded at the time they happen. An issue made without a record, a return placed back on the shelf without a note, or a material transferred between locations without an update all create a difference between the record and the physical stock, and the difference compounds over time. The second most common cause is the wrong unit of measure, where an item is stored in one unit and recorded in another. Both are solved by process discipline rather than by better software: record at the point of movement, and confirm that the unit in the system matches the unit on the label.
How do we decide when stock becomes obsolete?
By combining age with demand rather than using age alone. An item that has not moved for a long period and has no foreseeable demand against the order book or forecast is a candidate for disposal; an item of the same age that is a core material used across every program is not. The practical sequence is to run an ageing report, confirm the physical condition, check the balance against forward demand, assess whether the material can be used on another style or downgraded to a lower requirement, and then make a disposition decision with a date. Leaving the decision open is what turns surplus into permanent dead stock.
Should a small factory use software for inventory?
Software helps once the process is disciplined, and it does not substitute for the process. A small factory can start with coded labels, a location system, an issue rule, and a simple spreadsheet that is updated at the moment of movement, and that combination will outperform a full system used carelessly. The point at which software earns its cost is when the volume of items and movements makes manual tracking unreliable, or when several people need to see the same balance at once. Barcode scanning at receipt, issue, and count is usually the first upgrade worth making, because it removes the entry error that causes most record drift.
How does inventory control affect delivery performance?
Directly and immediately, because a shortage of a single trim component stops a line as effectively as a shortage of the main fabric. Factories that control inventory know before an order starts whether the material is on hand, which allows them to flag a risk while there is still time to expedite, substitute, or reschedule. Factories that do not control it discover the shortage at the moment of issue, when the options have narrowed to an emergency purchase at premium cost or a delayed shipment. The same control also protects against the opposite problem, where material is over-ordered and ties up the cash that would have funded the next program.
What should a buyer look for when assessing a supplier’s store?
Three things that are visible without opening a report. First, whether every location is labelled and every item is in its recorded place, which can be tested by asking for a specific component and seeing how long it takes to find. Second, whether lots and shades are separated with swatches kept, which shows whether the factory controls the colour risk that causes visible defects. Third, whether there is a visible ageing or slow-moving area, because a factory that manages its dead stock is a factory that reviews its own numbers. A store that can be navigated by a visitor is a store that is being managed by a system.
Conclusion
Inventory control in a bag factory is the discipline of knowing what material exists, where it is, which production it belongs to, and whether it is still usable. It governs margin, because material is the largest block of working capital and the easiest to lose quietly. It governs quality, because a shade break or an aged roll becomes a defect. It governs delivery, because a missing trim stops a line as surely as a missing fabric.
The controls that deliver it are unglamorous and inexpensive. Give every material a code and every location a label, so that an item can be found and identified without asking. Record every movement at the moment it happens, because a record that lags is a record that lies. Issue the oldest material first and compare lots before they are combined.
Count continuously in small sessions with the record hidden, and investigate every discrepancy rather than adjusting it away. Review ageing every month and dispose of what will not be used, because dead stock costs money whether or not it is recognised. And measure consumption against the allowance, because that is where unrecorded loss shows up.
For factories, the return appears as fewer line stoppages, fewer shade complaints, and cash that is not frozen in material nobody will use. A plant that can answer a question about any roll or component from a record is a plant that can promise a delivery date and keep it.
For buyers, the practical test is a short walk through the store with four questions: show me this part, tell me which order it belongs to, tell me how old the oldest roll of the main fabric is, and tell me what happens to material returned from the line. The answers describe the factory’s control system more accurately than any certificate.