A backpack line is a labour-intensive assembly operation with dozens of operations, hundreds of components, and a workforce that changes over time. In that environment, the difference between a factory that hits its output target and one that does not is rarely the machines.
It is how the work is organised: where material sits, how long a bundle waits, how far an operator has to reach, and whether anyone notices a defect while it is still one piece rather than fifty.
Lean manufacturing is the discipline of removing that hidden loss, and 5S is its foundation. Neither requires significant capital. Both require management attention on a daily basis, which is why they are easy to start and hard to sustain.
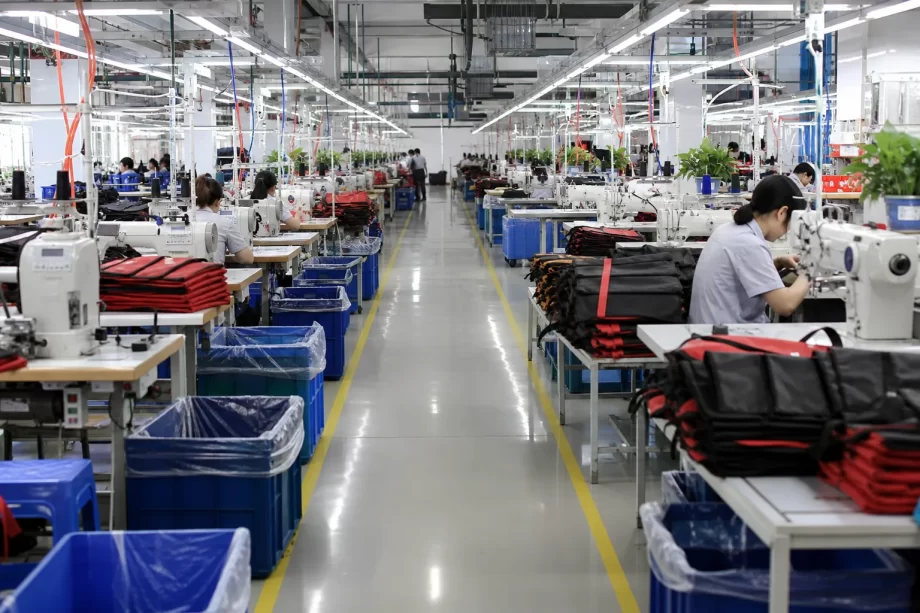
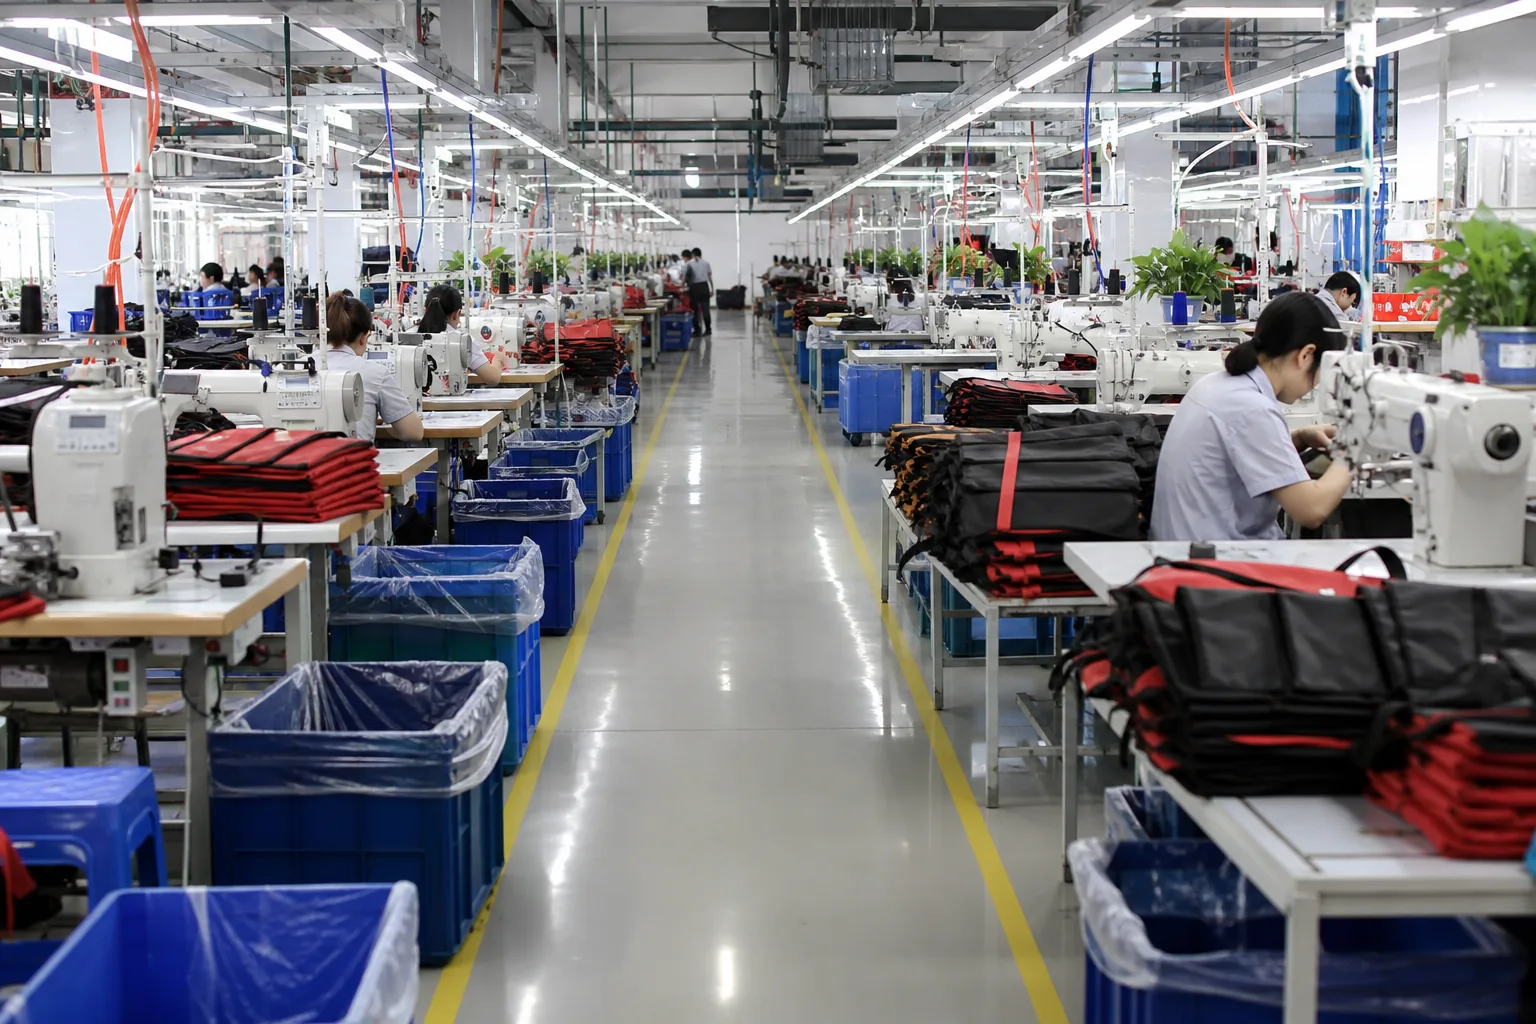
Tidy bag factory sewing line with marked floor zones
This guide covers lean and 5S specifically for backpack and bag production: why the industry benefits disproportionately, what waste actually looks like on a cut-and-sew line, how 5S is implemented and audited, how standard work and line balancing raise output without hiring, how material flow and kanban reduce work in progress, how quality is built in at the source, and how a program is sustained once the initial enthusiasm fades.
Bag assembly has characteristics that make waste both large and invisible. Work in progress hides defects, bundles accumulate between operations, and the effort of searching for a component is not recorded anywhere in the accounts.
The Line Characteristic Table
Characteristic
Implication
Many sequential operations
Queue time dominates
High labour content
Balance matters more than speed
Manual handling
Distance and reach create fatigue
Multiple components per unit
Material search is routine
Style changes frequently
Setup time is frequent
Variable operator skill
Standard work protects consistency
The Waste Table
Waste
Appearance on a bag line
Overproduction
Bundles waiting after a fast operation
Waiting
Operators idle for components
Transport
Trolleys moving bundles repeatedly
Over-processing
Re-inspection and re-trimming
Inventory
Racks of work in progress
Motion
Reaching, walking, searching
Defects
Rework, repair, and rejects
The Hidden Cost Table
Hidden cost
Where it appears
Queue time
Longer lead time, not higher labour
Search time
Absorbed into the standard cost
Rework
Disguised as normal output
Space
Working capital tied up
Lost output
Attributed to capacity limits
The Comparison Table
Condition
Consequence
Balanced line
Steady output, low inventory
Unbalanced line
Piles at the bottleneck
Large batches
Long lead time, hidden defects
Small batches
Faster feedback, lower inventory
Organised station
Less fatigue, fewer errors
Cluttered station
Searching, mixing, mistakes
The Impact Table
Improvement
Effect
Reduced queue
Shorter lead time
Balanced operations
Higher output from the same crew
Organised stations
Lower defect rate
Reduced transport
Less handling damage
Fewer defects
Less rework and lower cost
Manufacturer note: On a cut-and-sew line, the largest single loss is usually queue time, and it does not appear in the labour cost of any operation. A bundle that waits four hours between two operations costs nothing on paper and everything in lead time. Reducing the wait is often worth more than making any single operator faster.
The Seven Wastes on a Cut-and-Sew Line
Translating the classic waste categories into bag production makes them actionable. Each one has a specific symptom that a supervisor can see on the floor.
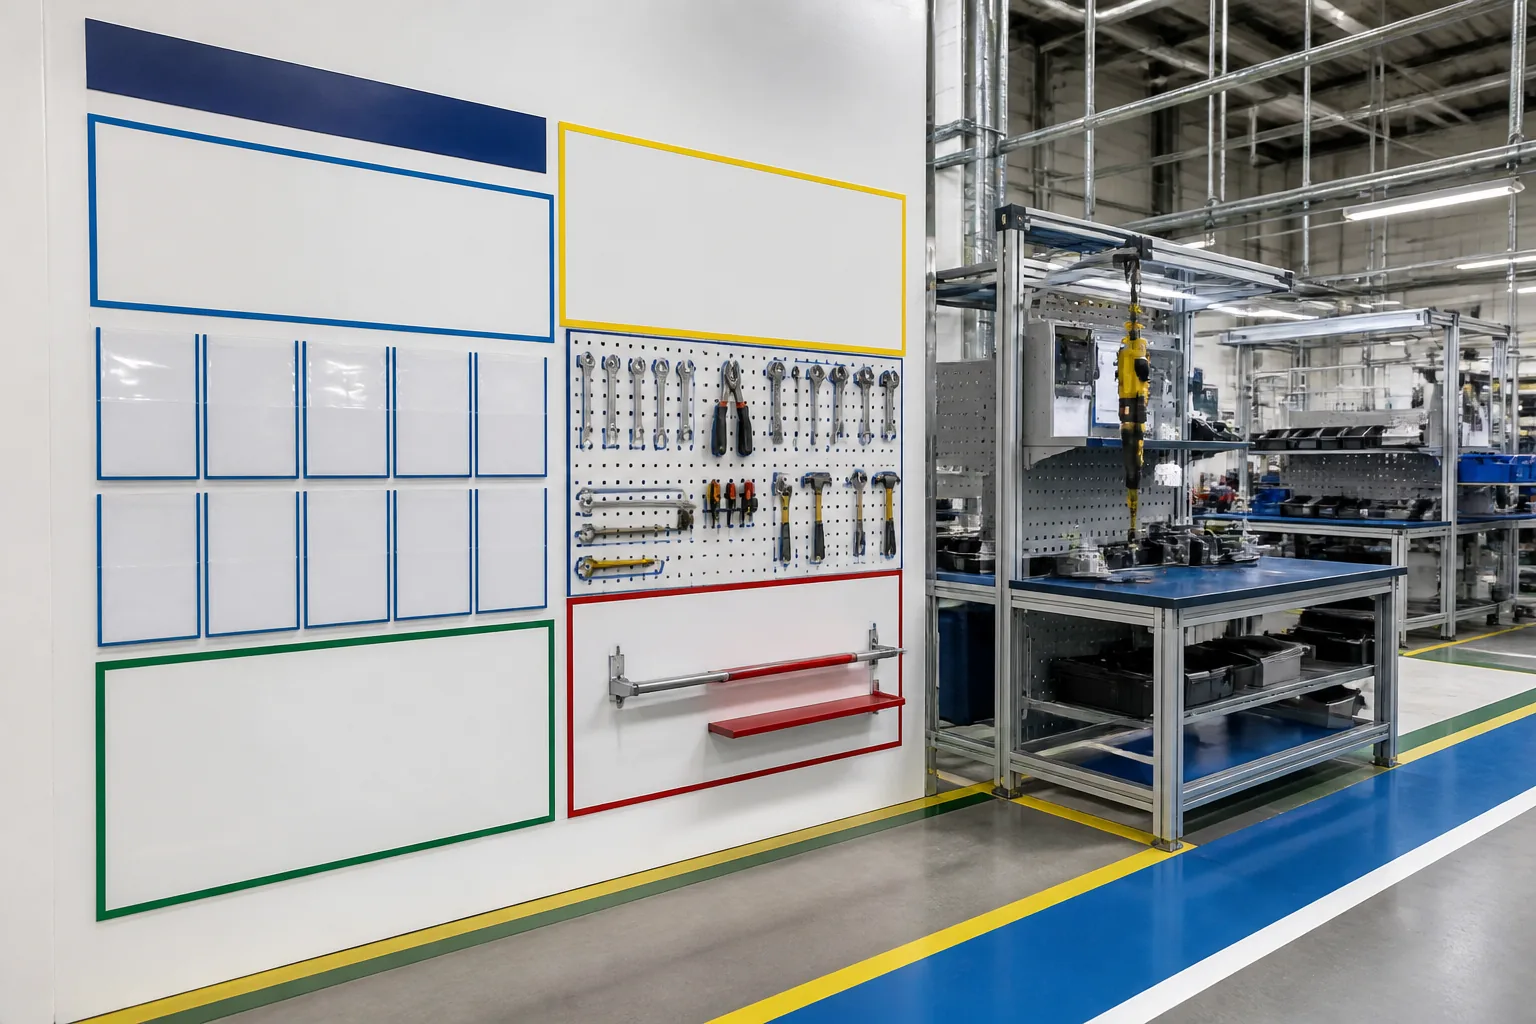
Factory 5S visual board beside an assembly workstation
The Overproduction Table
Symptom
Cause
Bundles stacked after a fast station
Unbalanced cycle times
Extra pieces cut in anticipation
Batch mentality
Early completion of an operation
Push scheduling
The Waiting Table
Symptom
Cause
Operator idle for a component
Supply not paced
Machine waiting for an operator
Multi-machine allocation
Line stopped for a missing part
Kitting not complete
The Transport Table
Symptom
Cause
Trolleys moving bundles repeatedly
Poor layout
Long distance from the store to the line
Store location
Double handling in and out of bins
Container design
The Inventory Table
Symptom
Cause
Racks of work in progress
Large transfer batches
Material at the station exceeding a shift
No pull signal
Unfinished components accumulating
Flow imbalance
The Motion Table
Symptom
Cause
Operator reaching behind to pick
Station layout
Walking to fetch tools
No point-of-use storage
Searching for the right part
No identification
The Over-Processing Table
Symptom
Cause
Re-inspection at the end of the line
Quality not at source
Re-trimming and re-pressing
Incoming quality issues
Extra checking of documentation
Unclear specification
The Defect Table
Symptom
Cause
Repairs accumulating at the final station
Defects not caught early
Same defect repeating across a shift
No corrective action
Rework hidden inside a bundle
No in-line check
The Observation Table
Observation
Waste type
Operator waiting for material
Waiting
Bundle sitting between stations
Overproduction or inventory
Walking to the tool room
Motion
Inspecting work already inspected
Over-processing
Fixing a stitch already accepted
Defect
Moving a rack twice
Transport
Wondering where a part is
Motion and inventory
5S as the Foundation
5S is a workplace organisation method whose purpose is to make the abnormal visible. Once a station has a defined place for everything, a missing tool or a misplaced component is obvious at a glance, and problems get noticed in minutes rather than at the end of the shift.
The Five Steps Table
Step
Japanese
Meaning
1
Seiri
Sort out what is not needed
2
Seiton
Set in order what remains
3
Seiso
Shine and clean
4
Seiketsu
Standardise the practice
5
Shitsuke
Sustain the discipline
The Sort Table
Item
Decision
Used every shift
Keep at the station
Used weekly
Keep in the line area
Used occasionally
Keep in the store
Not used for the current style
Remove from the line
Damaged or unknown
Dispose or identify
The Set in Order Table
Element
Requirement
Tool location
Marked and at point of use
Material bin
Sized to the consumption rate
Finished goods
Defined position
Rejects
Clearly marked container
Documents
Single agreed location
Floor markings
Show zones and walkways
The Shine Table
Task
Frequency
Clear the station of offcuts
Each shift
Clean the machine and table
Daily
Collect lint and thread waste
Each shift
Check for oil and debris
Daily
Inspect for wear while cleaning
Daily
The Standardise Table
Standard
Content
Station layout
Photograph and diagram
Tool list
What belongs at the station
Cleaning schedule
Who and when
Visual display
Board status and targets
Colour coding
Zone and container meaning
The Sustain Table
Mechanism
Purpose
Daily five-minute check
Habit formation
Weekly line walk
Management attention
Audit score displayed
Transparency
Team ownership
Accountability
Recognition
Motivation
The 5S Audit Table
Area
Rating
Sort
1 to 5
Set in order
1 to 5
Shine
1 to 5
Standardise
1 to 5
Sustain
1 to 5
The Visual Control Table
Control
Function
Floor markings
Define zones
Shadow board
Show missing tools
Bin labels
Identify contents
Reject bin colour
Segregate defects
Target board
Show performance
Andon signal
Call for help
Standard Work and Line Balancing
Standard work is the documented best sequence for an operation, and line balancing is the distribution of that work so that no single station holds up the line. Together they raise output without adding people.
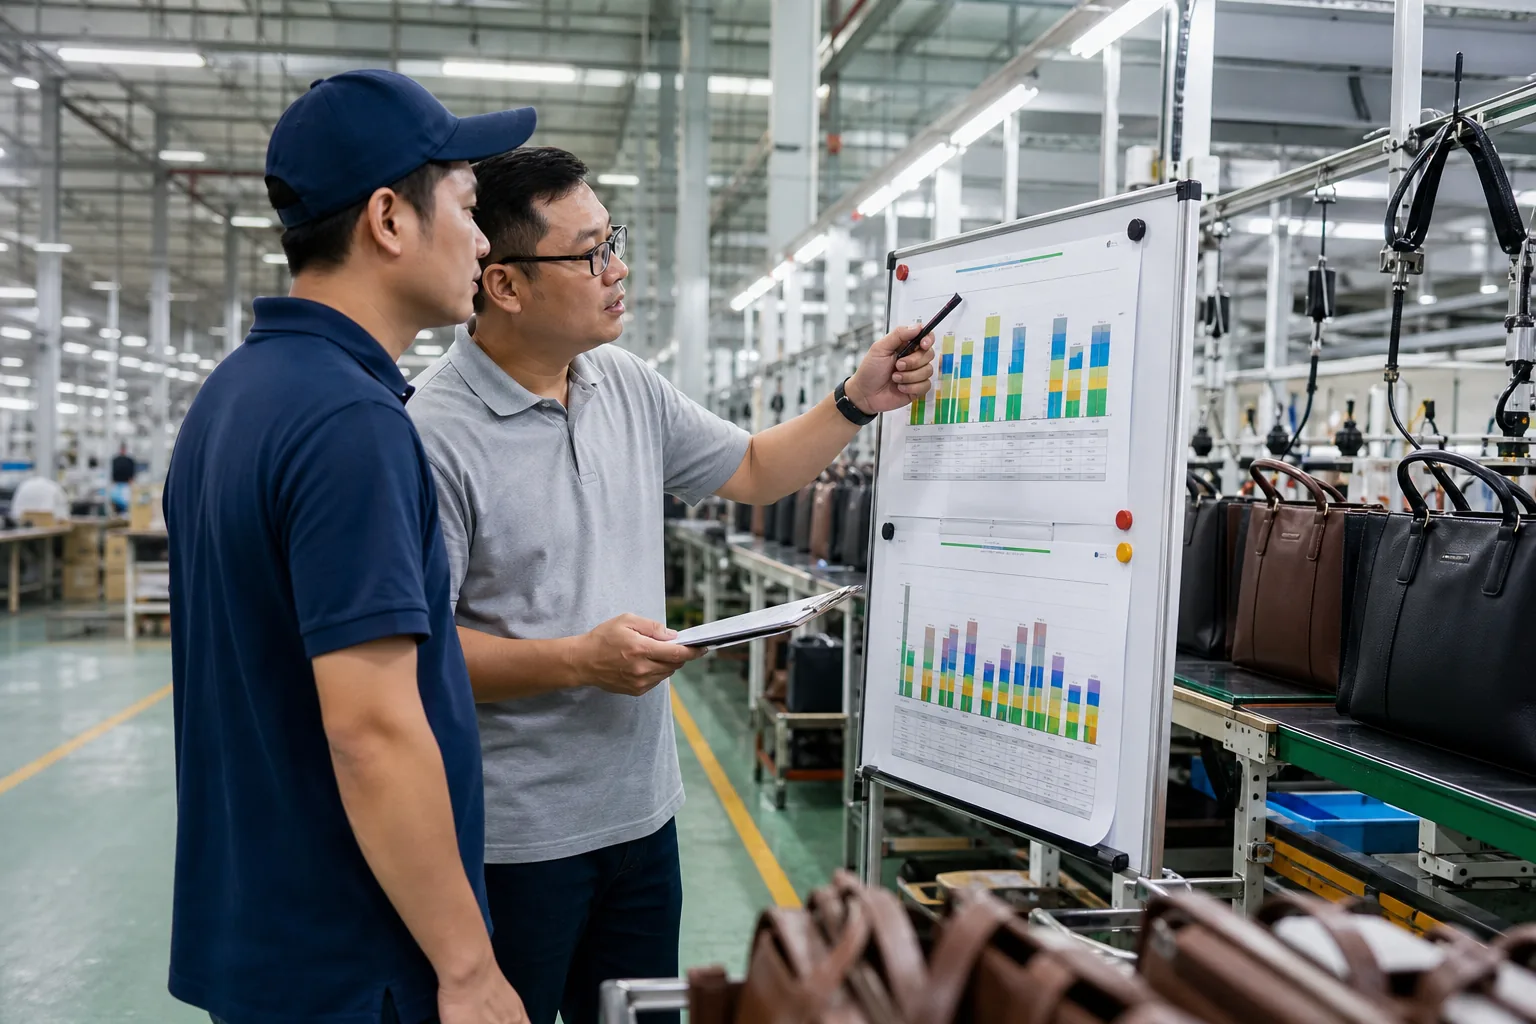
Supervisor and operator reviewing a line balancing chart
The Standard Work Table
Element
Content
Work sequence
The order of steps
Cycle time
Time per unit
Standard work in progress
Units at the station
Key points
Critical quality and safety points
Tact time
The rate the line must achieve
The Balance Table
Indicator
Meaning
Tact time
Required output rate
Cycle time
Actual time per unit at a station
Balanced
Cycle times close to tact
Bottleneck
Longest cycle time
Idle
Cycle time well below tact
The Measurement Table
Measurement
Method
Cycle time
Timed observation
Work content
Summed element times
Waiting time
Observation of idle
Walking distance
Measured or estimated
Defect rate
In-line inspection records
The Balancing Action Table
Problem
Action
One station is the bottleneck
Move elements to a neighbour
Several stations idle
Consolidate operations
Wide variation between operators
Standardise and retrain
Long walking distance
Rearrange the station
The Layout Table
Layout
Character
Process-based
Machines grouped by type
Product-based line
Sequence follows the product
U-shaped cell
Operator flexibility
Modular cell
Small team builds a unit
The Flow Table
Principle
Effect
One-piece flow
Immediate feedback
Small transfer batches
Lower inventory
Continuous flow where possible
Shorter lead time
Pull instead of push
Matches demand
The Bottleneck Table
Situation
Response
Machine-limited
Reduce setup or add capacity
Labour-limited
Balance or add support
Quality-limited
Fix the defect source
Material-limited
Improve kitting and supply
Changeover and Style Flexibility
Bag factories run many styles. Changeover is therefore a frequent event, and the time it consumes is a direct loss of output unless it is reduced deliberately.
The Changeover Table
Element
Internal
Machine setting change
Yes
New pattern and gauge
Yes
Material brought to the line
Can be external
Work instruction update
Can be external
First-piece inspection
Yes
The Conversion Table
Activity
Before
After
Fetching tooling
During changeover
Pre-staged
Retrieving the pattern
During changeover
Pre-staged
Checking material
During changeover
Pre-verified
Briefing operators
At changeover
Beforehand
The Setup Step Table
Step
Timing
Prepare tooling and pattern
Before the line stops
Stop the previous style
At the end of the batch
Change machine settings
During the stop
Load the new material
During the stop
Verify the first piece
During the stop
Release to production
After verification
The Standardisation Table
Control
Purpose
Setup checklist
Consistent sequence
Parameter card
Correct settings
Reference sample
Visual standard
First-piece check
Quality gate
The Flexibility Table
Factor
Effect on flexibility
Short setup time
More style changes possible
Small minimum batch
More styles per month
Cross-trained operators
Reassignment without delay
Modular cells
Independent style handling
Material Flow and Kanban
Material flow determines how much work in progress sits on the floor. Push systems deliver more than the line consumes; pull systems deliver only what the next operation needs.
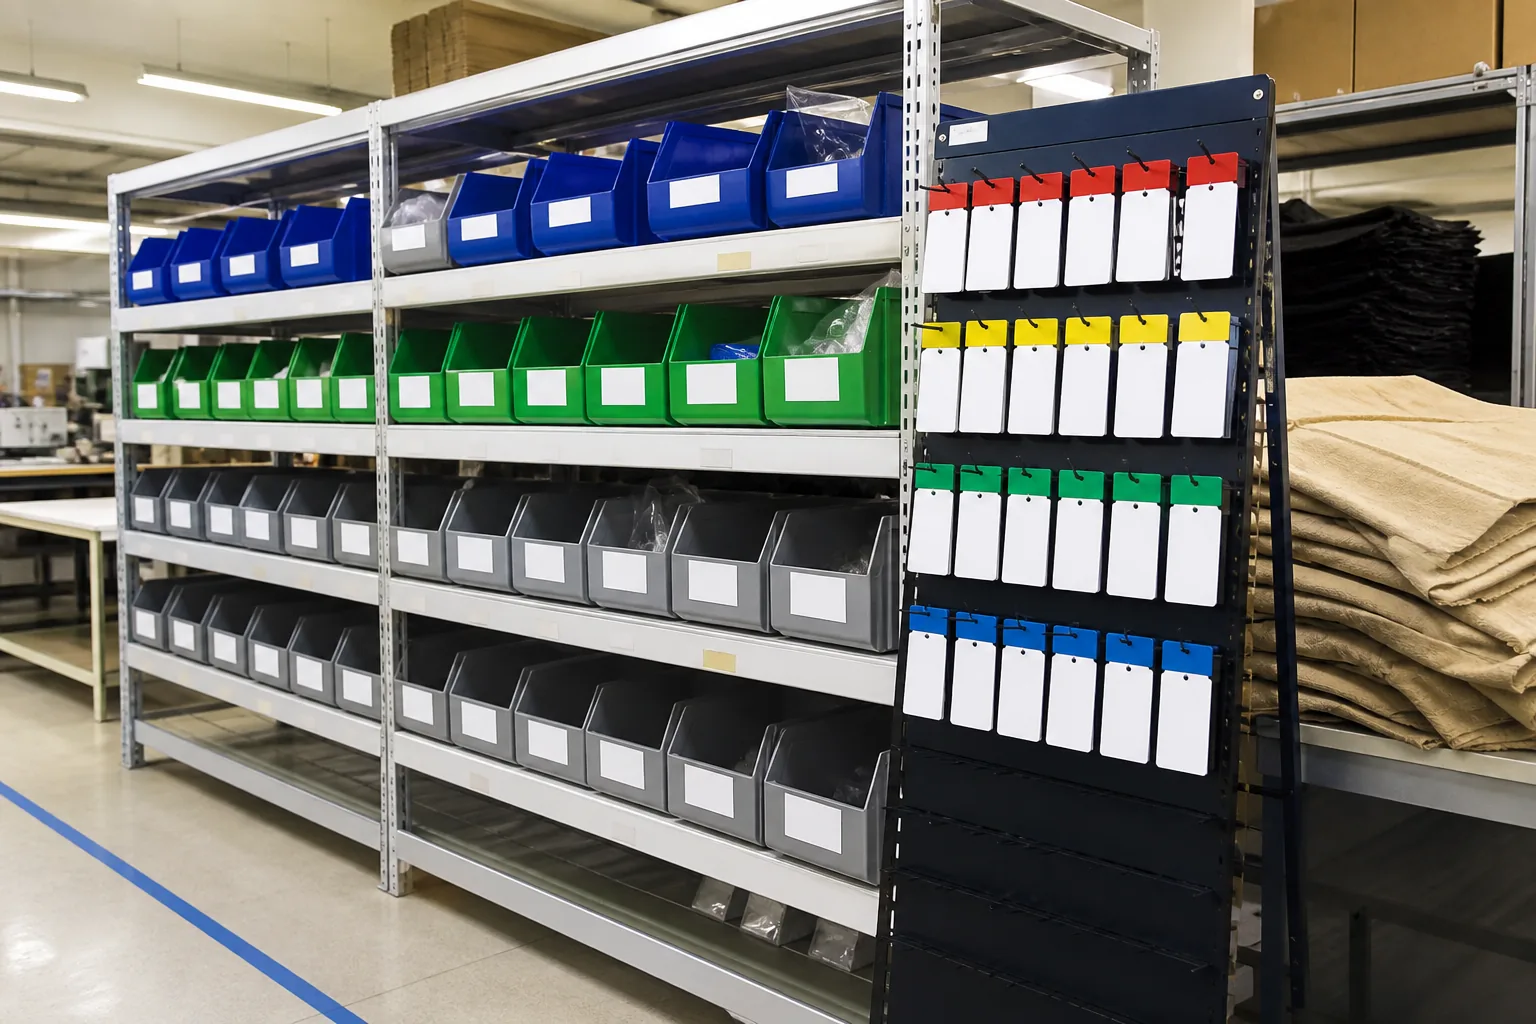
Store room with labelled bins and a kanban card rack
The Flow System Table
System
Character
Push
Supply driven by plan
Pull
Supply driven by consumption
Kanban
Signal triggers replenishment
Supermarket
Controlled buffer of stock
Kitting
Complete set per unit
The Kanban Type Table
Type
Use
Production kanban
Authorises making a batch
Withdrawal kanban
Authorises moving material
Supplier kanban
Signals an external order
Signal kanban
Triggers a batch at a process
Two-bin
Simple visual reorder
The Container Table
Container
Function
Standard bin
Fixed quantity per card
Colour coded
Identifies the operation
Sized to the rate
Controls flow
Returnable
Enables the loop
The Kitting Table
Item
Included
Panels
All body components
Hardware
Buckles, zips, pulls
Labels
Brand and care
Lining
Cut and prepared
Sundries
Thread, elastic, webbing
The WIP Control Table
Level
Indicator
Low
Flow is working
Rising
A station is falling behind
Concentrated
A bottleneck exists
Falling
Demand has dropped
The Store Table
Function
Requirement
Location control
Every item has a home
Quantity control
Minimum and maximum
Age control
Oldest issued first
Identification
Clear labelling
Issue control
Recorded against the order
The Material Risk Table
Risk
Control
Shortage stops the line
Minimum level and reorder point
Excess ties up cash
Maximum level
Mixed lots
Lot segregation and records
Damage in handling
Container and handling standards
Obsolescence
Age review and rotation
Quality at the Source
Lean quality is built into the operation rather than inspected at the end. The objective is that a defect is detected by the operator who created it, while the piece is still in their hands.
The Principle Table
Principle
Practice
Do not accept a defect
Check the incoming piece
Do not make a defect
Follow standard work
Do not pass a defect
Check the outgoing piece
Stop and call
Use the andon signal
Fix the cause
Corrective action
The Check Table
Check
Purpose
Self-check
Operator verifies own work
Successive check
Next operator verifies the previous
In-line inspection
Patrol inspection
Final audit
Sampled confirmation
The Error Proofing Table
Method
Example
Physical fit
A part that only fits one way
Template
Pocket placement guide
Colour coding
Right zipper tape per panel
Sensor
Detect missing component
Checklist
Order of operations
The Defect Handling Table
Situation
Action
Defect found by the maker
Repair and record
Defect found downstream
Return and analyse
Repeated defect
Stop and investigate
Defect reaching the customer
Full containment
The Corrective Table
Step
Action
Contain
Separate affected units
Describe
Define the defect precisely
Analyse
Find the cause
Correct
Remove the cause
Verify
Confirm the fix
Standardise
Update the standard
Metrics and Visual Management
Lean works on measurement that the team can see. A target board that nobody reads has no effect; a small number of visible metrics that the team owns change behaviour.
The Metric Table
Metric
Measure
Hourly output
Units against target
First-pass yield
Good units without rework
Defect rate
Defects per hundred
Work in progress
Units on the floor
Lead time
Days from cut to pack
Space per unit
Area used per output
Walking distance
Metres per operator
The Baseline Table
Metric
Why a baseline
Output
Shows improvement
First-pass yield
Quantifies rework
WIP
Shows flow improvement
Lead time
Demonstrates responsiveness
Space
Shows layout gain
The Visual Board Table
Element
Content
Target
What is expected
Actual
What happened
Trend
Direction over time
Issue
What is blocking
Action
Who is doing what
The Review Table
Frequency
Focus
Hourly
Output and line stops
Daily
Issues and recovery
Weekly
Trends and improvement
Monthly
Program progress
The Andon Table
Signal
Meaning
Normal
Running to standard
Material needed
Replenishment required
Quality issue
Investigation needed
Machine problem
Maintenance required
Continuous Improvement
Improvement is a routine, not a campaign. The mechanism that sustains it is small, frequent action by the people who do the work, supported by management attention.
The Improvement Cycle Table
Step
Action
Observe
Go to the station
Describe
State the current condition
Set the target
Define what better looks like
Try
Make a small change
Check
Measure the effect
Standardise
Lock in what worked
The Team Table
Role
Responsibility
Line leader
Daily improvement actions
Supervisor
Support and remove blockers
Engineer
Technical changes
Quality
Standards and verification
Management
Resources and attention
The Suggestion Table
Element
Practice
Raising an idea
Simple form or board
Review
Weekly, quick
Feedback
Always given
Implementation
Small, immediate
Recognition
Visible and timely
The Barrier Table
Barrier
Response
No time to improve
Schedule it
No authority to change
Give a small budget
No feedback on ideas
Close the loop
Improvement not recognised
Publicise wins
Change reverted
Standardise properly
The Spread Table
Stage
Activity
Pilot line
Prove the method
Document
Record what worked
Train
Teach other leaders
Replicate
Roll out line by line
Verify
Audit the result
Implementing Lean on a Bag Line
A lean program fails when it is launched as a company-wide initiative with a slogan and no visible change on the floor. It succeeds when it starts on one line, produces a measurable result, and spreads because other teams want the same improvement.
The Roadmap Table
Phase
Focus
1
Baseline measurement
2
5S on one line
3
Station standardisation
4
Line balancing
5
Material flow and kanban
6
Quality at source
7
Spread to other lines
The Pilot Selection Table
Criterion
Preferred
Line stability
Moderate, not chaotic
Team attitude
Willing to try
Supervisor
Engaged and respected
Visibility
Easily seen by others
Measurability
Output can be counted
The Baseline Step Table
Step
Action
1
Count current output
2
Measure work in progress
3
Record defect and rework rates
4
Measure lead time
5
Photograph the current state
The First Week Table
Day
Activity
1
Brief the team and walk the line
2
Sort and remove what is not needed
3
Set locations and mark the floor
4
Clean and inspect
5
Agree the standard and the audit
The Milestone Table
Milestone
Evidence
5S audit above target
Audit score
Output improved
Production records
WIP reduced
Floor count
First-pass yield improved
Inspection records
Lead time shortened
Order records
The Resource Table
Resource
Typical need
Management time
Weekly floor walk
Supervisor time
Daily routine
Paint and marking
Low cost
Bins and racks
Moderate
Training
Short sessions
Documentation
Templates
The Communication Table
Audience
Message
Operators
What changes at their station
Supervisor
Routine and targets
Management
Results and support needed
Buyer
Lead time and quality stability
Common Failures and How to Sustain
Most lean programs fail for organisational reasons rather than technical ones. The method is not complicated; maintaining attention on it is.
The Failure Table
Failure
Cause
5S fades within weeks
No daily routine
Audit score treated as a target
Gaming the score
Improvement reverts
No standardisation
Line balancing on paper only
No measurement
Kanban cards disappear
No container discipline
Program stops after the pilot
No spread plan
Operators not involved
Top-down imposition
The Sustainability Table
Mechanism
Frequency
Five-minute station check
Daily
Line walk by management
Weekly
Audit with a visible score
Weekly
Improvement review
Weekly
Refresher training
Quarterly
Standard review
On every change
The Discipline Table
Discipline
Reason
Everything in its place
Makes abnormality visible
Standard followed
Consistency across operators
First piece verified
Catches changeover problems
Andon used honestly
Problems surface early
Clean at end of shift
Condition monitoring
Records completed
Evidence and trend
The Regression Table
Signal
Response
Audit score falling
Re-train and re-focus
WIP rising
Check the bottleneck
Rework rising
Check the standard and training
Tools missing
Reinforce shadow boards
Material in the aisle
Re-mark the zones
The Measurement Trap Table
Trap
Effect
Measuring only output
Pressure to overproduce
Ignoring first-pass yield
Rework hidden
Counting WIP as progress
Inventory treated as success
Auditing without action
Cynicism
What Lean Means for Buyers and Suppliers
A buyer does not run the factory’s line, but the state of the line is visible in the supplier’s lead time, quality stability, and responsiveness to a change. A lean supplier behaves differently on all three.
The Supplier Signal Table
Signal
What it indicates
Short, stable lead time
Flow is under control
Consistent first-pass quality
Standard work exists
Willingness to take small orders
Setup time is short
Fast response to a change
Flexible capacity
Visible metrics
Management attention
The Buyer Question Table
Question
What it reveals
What is your work in progress?
Flow control
How long is changeover?
Flexibility
How do you check the first piece?
Quality gate
Who measures yield?
Improvement discipline
What is on the line board?
Visual management
The Ordering Behaviour Table
Buyer behaviour
Effect on the line
Stable forecast
Enables levelling
Frequent small changes
Raises changeover loss
Very large batches
Raises inventory
Late specification changes
Disrupts standard work
Realistic lead times
Allows steady flow
The Partnership Table
Practice
Benefit
Sharing a rolling forecast
Better material planning
Agreeing a minimum batch
Balanced setup cost
Reviewing lead time together
Realistic commitments
Visiting the line
Evidence of capability
Joint problem solving
Faster corrective action
The Lean and 5S Checklist
Baseline
Item
Done
Current output measured
☐
Work in progress counted
☐
Defect and rework rates recorded
☐
Lead time measured
☐
Current state photographed
☐
5S on the Line
Item
Done
Unused items removed
☐
Tool locations marked
☐
Material bins sized and labelled
☐
Floor zones painted
☐
Cleaning routine assigned
☐
Station standard documented
☐
Audit score displayed
☐
Standard Work and Balance
Item
Done
Work sequence documented
☐
Cycle times measured
☐
Tact time known
☐
Bottleneck identified
☐
Elements reallocated
☐
Key quality points marked
☐
Flow and Material
Item
Done
Transfer batch size reduced
☐
Kanban or two-bin system in use
☐
Container quantities fixed
☐
Kitting introduced
☐
Store locations controlled
☐
Reorder points set
☐
Quality and Improvement
Item
Done
Self-check at each station
☐
First-piece verification in use
☐
Andon signal available and used
☐
Corrective action recorded
☐
Metrics displayed and reviewed
☐
Improvement routine scheduled
☐
The Eight Rules
Rule
Reason
Measure the baseline before changing anything
Improvement otherwise unprovable
Start on one line, not the whole factory
A visible win spreads faster than a plan
Make abnormality visible
Problems cannot be fixed unseen
Give everything a place
Searching is a hidden cost
Document the standard before training
Verbal standards leave with staff
Balance work to tact, not to habit
Output rises without hiring
Pull material instead of pushing it
Work in progress is the main hidden loss
Standardise every improvement
Otherwise it reverts within weeks
FAQ
Does a bag factory need a large investment to start lean?
No. The first improvements on a cut-and-sew line are almost always organisational rather than capital: removing items that are not needed from the station, marking where tools and bins belong, measuring cycle times with a stopwatch, and moving two operations to balance a bottleneck. Paint, labels, a few bins, and management time are usually the only inputs. Capital becomes relevant later, when a bottleneck is genuinely machine-limited, and by then the data exists to justify the spend rather than guess at it.
What is the difference between 5S and lean manufacturing?
5S is the foundation and lean is the whole system. 5S organises the workplace so that the abnormal becomes visible: a missing tool, a misplaced component, or a station that has not been cleaned is obvious at a glance. Lean builds on that visibility to attack the seven wastes, balance the line, control material flow, and improve quality at the source. Attempting lean without 5S usually fails, because without a stable and visible workplace it is impossible to tell whether a change actually improved anything.
How do we balance a line without hiring more people?
Measure the cycle time of every operation, identify the tact time the line has to achieve, and find the station whose cycle time exceeds it. That station is the constraint. The first response is usually to move work elements off it to neighbouring stations that have spare capacity, which raises output without adding labour. Where that is not possible, the answer may be a small tooling or fixture improvement, a change in the material presentation, or a redistribution of the work across a different number of operators.
What is the biggest waste on a backpack line?
Queue time is usually the largest and least visible. A bundle that waits several hours between two operations costs nothing in the labour cost of either operation, so it never appears in the accounts, but it lengthens the lead time and hides defects behind a wall of inventory. Reducing transfer batch size and moving to pull-based material flow attacks it directly. On lines that already have short queues, the dominant loss is often motion and searching, which 5S addresses.
How is a 5S audit done properly?
With a short, consistent checklist covering each of the five steps, scored on the same scale every week, by someone who walks the line and looks at the actual condition rather than the paperwork. The score should be displayed where the team can see it, and any score below target should produce a specific action with an owner rather than a general instruction to improve. The point of the audit is not the number; it is that the number makes the conversation about the condition of the station concrete and frequent.
Why do 5S programs fade after a few weeks?
Because the routine stops. The initial clean-up is a project with a visible result, and the discipline that maintains it is a daily habit that nobody enjoys enforcing. Programs that last have a fixed five-minute end-of-shift check, a weekly line walk by management, a visible audit score, and a supervisor who treats the routine as part of the job rather than an extra. Where the routine is not scheduled, the station gradually returns to its previous state and the program is judged to have failed.
How does lean affect lead time?
Mainly by reducing the time material spends waiting rather than the time it spends being worked on. In a typical cut-and-sew line, the actual processing time is a small fraction of the total lead time; the rest is queueing between operations, waiting for material, and sitting in a finished-goods area. Reducing transfer batches, pulling material instead of pushing it, and shortening changeover time all reduce the waiting component, which is where most of the lead time is.
Should we start lean on the whole factory at once?
No. Starting on one line produces a measurable result with limited risk, and it creates an internal example that other supervisors can see and want. A whole-factory launch spreads management attention across every team, produces no single clear result, and usually runs out of momentum. Pick a line with a willing supervisor, a stable enough process, and output that can be counted, run the program for a quarter, and document what changed so that the result can be replicated line by line.
What should a buyer look for to tell if a supplier is genuinely lean?
Visible evidence rather than certification. A line with marked floor zones, tools on shadow boards, a target board showing hourly output, a kanban or two-bin material system, and a supervisor who can state the current work in progress and first-pass yield. Ask what the changeover time is for a style change, how the first piece is verified, and who measures yield. A supplier who answers those from records is running the discipline; one who answers from intention is not.
How is improvement sustained when orders change or staff turn over?
Through written standards and a routine that does not depend on a particular person. The work sequence, the station layout diagram, the tool list, and the inspection points should be documented and reviewed whenever the style or the process changes, and new operators should be trained against the document rather than beside whoever happens to be available. The routine of the daily check and the weekly walk has to be owned by the supervisor as part of their normal job, because a program that depends on a project manager’s enthusiasm ends when the project ends.
Conclusion
Lean manufacturing on a backpack line is not a capital project. It is the systematic removal of the loss that hides inside a normal working day: the bundle that waits, the operator who searches, the station that is not balanced, the defect that travels fifty pieces before anyone notices.
The method begins with 5S, because a workplace where everything has a defined place makes every abnormality visible. It continues with standard work, so that the best method is documented and followed rather than passed on verbally.
It applies line balancing to raise output from the existing crew by moving work off the constraint. It controls material flow through kanban and kitting so that work in progress stops accumulating on the floor. It builds quality into the operation so that defects are caught by the person who made them. And it sustains all of this with a routine of daily checks, weekly walks, a visible score, and a habit of small, standardised improvements.
For factories, the return is concrete: shorter lead time, more stable quality, and the flexibility to take smaller orders and more style changes without losing output. A plant that can quote short lead times from a line that genuinely flows has a commercial advantage that is hard to copy quickly, because it comes from discipline rather than equipment.
For buyers, the practical test is to walk the line rather than read the certificate. Marked zones, a visible output board, a stated work-in-progress figure, and a supervisor who knows the changeover time and the first-pass yield together say more about a supplier’s capability than any audit score. The discipline shows in the condition of the station, and it shows long before it shows in the price.